Underground Geological Face Mapping For Grade Control
In the mining operation process, we can define the transfer of every cavity we create underground onto a plane according to criteria determined by geological and other needs as “underground face mapping.” Underground face maps not only confine themselves to the geology and structure of ore masses but also undertake a significant archival role in the underground mining process. Especially in shift work and production processes, underground geological maps will be created by different geologists or personnel. Therefore, at the beginning of the operation, it is necessary for the most suitable and error-free system for your mining operation process to be established, and for all personnel to embrace the same standard procedure with strict discipline. In this article, we aim to create an underground drive geological face mapping procedure inspired by a successful system.
Mapping and grade control programs have an important place in the production process of many ores of all sizes and types, ranging from highly profitable mining activities such as gold, silver, copper, lead, zinc, etc. Although it is not called “Underground Mapping” in relatively modest sized mines, there are also processes that are functionally similar to those based on personnel memories. So what are the norms for this today? Who needs maps and why?
Additionally, you can explore the related articles listed below.
Question the Necessity of Underground Face Mapping and RL Map
Mapping in underground galleries often forms the basis of a “Grade Control” program. Whether or not sampling is involved, mapping is the beginning of mining in itself. Because the “old people” did the mapping mentally and imagined, finding the ore and digging it in short unit advances. Nowadays, since it is a drill-and-blast issue, we do not like surprises due to the size of this unit progress. Let’s start by asking whether any of the following items make sense to us in our work.
- Following up the ore mineral requires an expert or very accustomed eye. The ore you will be operating requires face monitoring & follow up due to its characteristics, e.g. gold bearing quartz veins and surrounding valuable alteration zones, massive lead, zinc and copper sulphides that are reticulated and show abundant boudinage…
- In your ore model, if you work with more than one “level, cell or wall” in the volume you have determined as operable, the continuity of the mass you see in ongoing progress will appear again in the future.
- You are likely to encounter the continuity of structural elements such as faults and weak zones in your underground spaces again, and perhaps after a very long time.
- You need to follow the ore body underground, the intervals of the drillings you make from above are naturally much more than a few meters, you want to get the ore into the section of galleries you will drive in the most efficient way.
- In some places, mineralization is greater than your standard progress width, so you have to come back at a later date and take what is behind this wall.
- You will be applying stopes or floor carving, you may have already produced the top or bottom a long time ago and you want to use your experiences and you find it difficult to remember.
- You have spent a lot on drilling and have obtained a lot of data (Drilling Log), you think that by comparing this data with maps you can predict what you will encounter before underground progress.
- You lost the ore follow up in progress, you progressed already and you don’t realize when you lost it, or did you run out of orebody, there is hope to come back to you in the future?! The situation has gotten messy, let’s skip this point.
- Your production expectations have not been realized, you question whether there is a self-control mechanism.
- According to the drillings, you need to interpret many mineralizations passing near your galleries, which are opportunities that you could not include in the plan in the beginning.
- BONUS: You will make an underground drilling plan program…
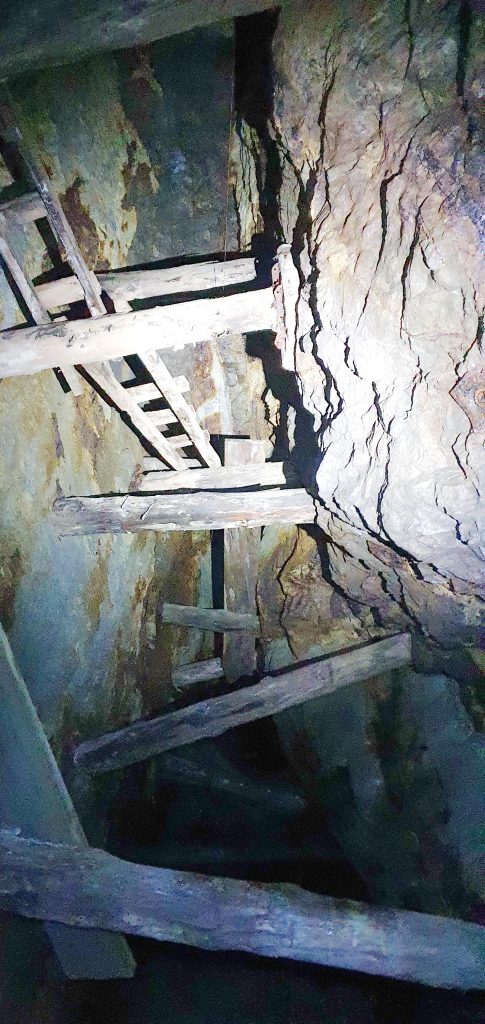
Map the Gallery / Drive / Drift Progress Face
As you proceed, you should note the lithology and structural elements on all walls, especially the drive face, before supporting the open spaces made by drill-blast or other methods. Sometimes, even if the rock strength is deemed sufficient and progress is made without support, fresh outcrops opened due to underground operating conditions become dirty in a short time and become unsuitable for observation. For this reason, after the progress and haulage of the material (production), the walls should be observed immediately and proper mapping should be carried out. In addition, since mining usually works in shifts, different employees must carry out standards-based mapping, free from comments, as if it were produced by a single source. In the ongoing process, shift work should be taken over without any problems and continuity should be ensured by recording only the area needed without overlapping maps. As a result of all this, a system and its adoption by the personnel are essential.
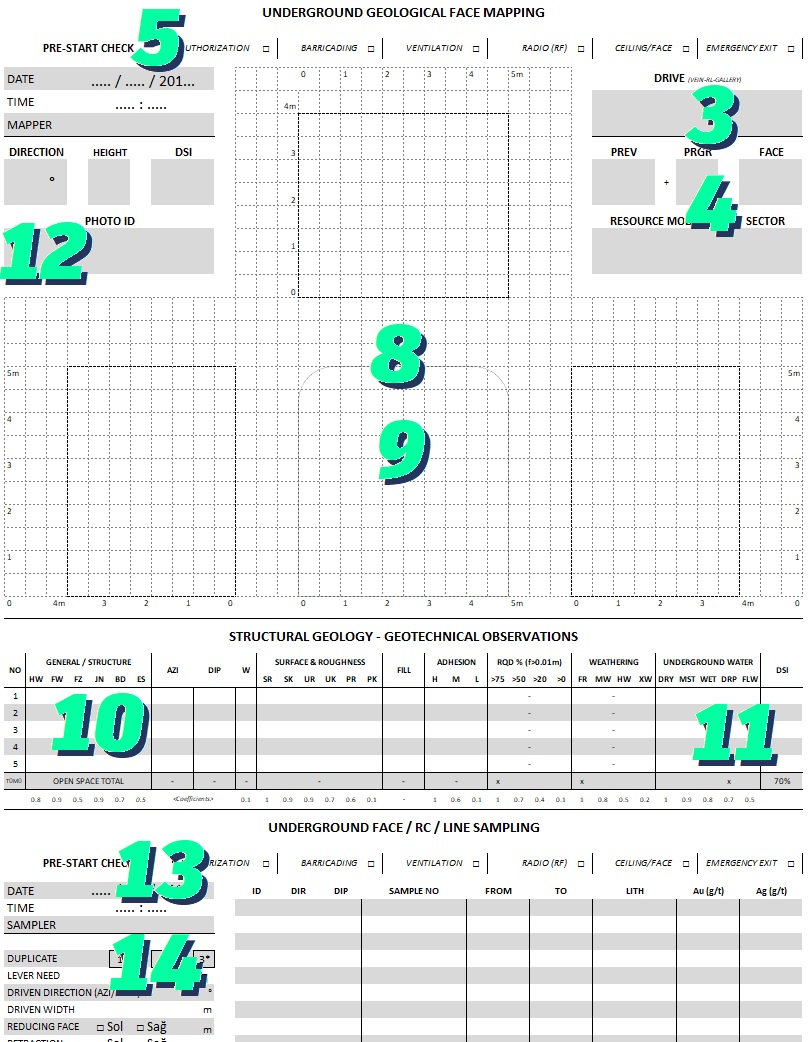
We will go through an optimized one-page sample mapping form with elements carefully selected as a result of years of experience. You can use this form basis either handheld, digitally on a tablet, or with automation using photography and laser-based scanning methods. When preparing your forms, try to set criteria that do not require multiple choice or writing as much as possible, because the environment makes writing difficult and bad handwriting will be difficult to read. Let’s proceed step by step by giving tips and tricks for the geologist who will follow and perform underground face mapping. We have a short list of needs, let’s not forget to complete them: Map form, previous maps, secretarial work, strong light, compass, spray paint, tape measure, pencil, camera, tripod and extension rod, geologist, map measurement personnel, for office work your server/disk and your computer. You can follow the steps with heading numbers on the sample form provided.
1. Face (Drive) is Ready for Mapping, Get Started
Someone needs to inform you that you need to “do the mapping”. For this reason, your communication should be open with the underground shift supervisor responsible for progress. The shift supervisor should inform you via radio announcement or with the communication you made at the beginning of shift, when the mass in front of the face has been hauled. Washing the face surface to be mapped is a very difficult job, it takes time, requires water line and machine, do it if necessary. However, the pressurized water you send to the surface and the walls will turn the dust on the face into mud and plaster the surfaces, obstructing your vision. You will need a long time for washing to avoid being affected by this, remember it if happens.

2. Review the Last Face Map
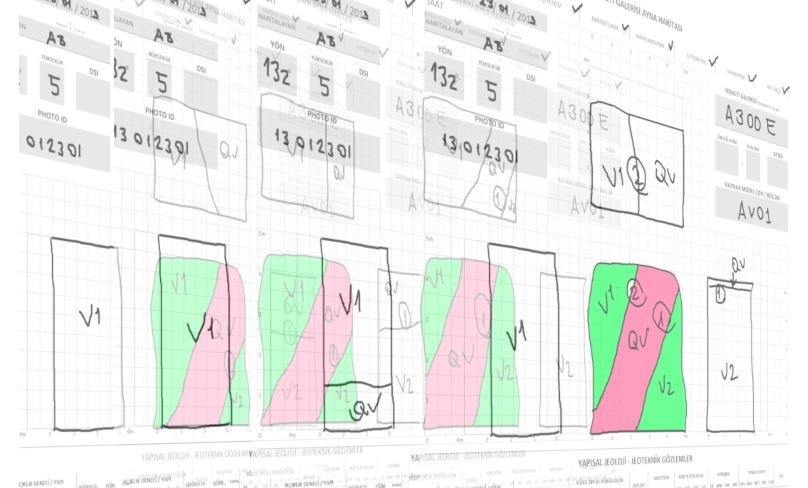
To start mapping, quickly examine the structures recorded in the previous progress and determine where and how you can observe the rest on which wall. Before going to the face, it will be useful for you to have at least 1 or, if possible, 2 faces in your mapping folder/hard case or in your memory if you are doing it digitally.
3. Determine the Face or Gallery Name if It is Not Predetermined
Just as when specifying an address, you can specify country-city-district etc. If we go from the general to the specific, we choose a practical addressing technique that can be understood by everyone in underground faces, both in communication and business follow-up. Since progress is focused on underground production here, first the “vein code” and then the “level” (RL); Finally, if the progress is in ore, the direction of the progress towards one of the 4 main directions or the code of the progress purpose is entered and the gallery address is determined with 3 different inputs.
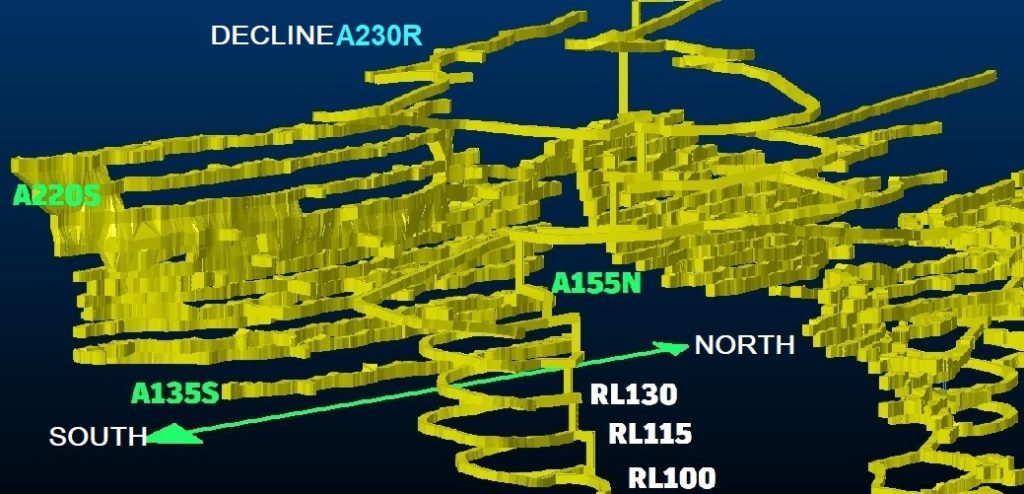
For example, you entered a vein that you drilled with drilling and named “A” at the “300” elevation, split into 2 branches and move in the west direction, you are 10 meters inside the gallery from the point where you split into 2 branches; The name of this gallery becomes the A300W gallery, and when we add the progress meter in this progression, we can find you at “A300W+010m”. Or for the “B” vessel, you go down the ramp to level 100 (Target) and you have a face at 210 meters. You can use the name “B100R+210m” when naming your face. Use codes that are as short and memorable as possible in naming, and never compromise your standards. You have determined the gallery name, but let’s get clearer by reading further for the progress meter.
4. Select the Wall to Follow the Progress Meter

You always need a base point to map an outcrop and name the map. The point you use should be based on a standard measurement that is not open to interpretation by anyone and should be easily accessible. For this reason, a wall is selected at the gallery entrance, starting from “0” and will not be changed until the end. “Progress meters” are marked starting from “0” by placing the tape measure fully against the selected right or left wall. Always use integers in form and file naming, rounding numbers to half. If progress is made in the ore gallery, the wall on the hanging wall side is selected. In the preparation galleries, it would be more appropriate to choose the wall towards the outside of the bend, taking into account the bends in the planned gallery, as it will be relatively easier to measure as there will be retraction inside the bend. For wells or steep slopes, the most logical metering should be done in this method.
5. Get to the Face (UG Drive) and Perform Pre-Start Checks
Once you have the information that the face is ready, go to the face without wasting any time; Make a note of the date, your arrival time, the mapper and the chaperones. As perhaps the first technical eye to see progress, you are aware that all the data you can collect and record will benefit your underground business. When going for mapping, check the authorizations given, the barricades that must be passed or placed, the adequacy of ventilation, the radio communication is open or the nearest communication point is working smoothly, there are no cracks, cracks or similar hazards and that you are aware of the nearest emergency exit point and enter it into the form. You can add additional controls to your form in consultation with the mining team. If your mapping form reaches a standard, it becomes a legal document and is taken as a responsibility by those concerned. If there is a significant nonconformity in your pre-start checks, do not forget to suspend the mapping and inform the underground shift supervisor without wasting time.
6. Measure and Mark the Progress Meter
Progress meters are given to represent the faces formed after each drilling-blasting or stopping after a certain amount of progress. These meter images can be given different names, they are generally considered “geological meters”. The walls are marked with a “+” in front of them with spray paint. Even if the paint is covered with dust, the marking can be renewed by taking a meter from any point that can be traced back. During the mining process, it serves as an address for retrospective operations on “faults, ore remaining at the bottom, operations to be carried out on side walls, service lines” and many similar issues, and provides benefits for everyone as a reference point. If the area (face) to be mapped requires reinforcement/fortification, use a laser distance measuring device. You can use the device by leaning it against the wall, or if you do not have such facilities, you can visually give a temporary meter and update the measurement when you go to the face after fortification.

7. Place Yourself, Take a Mapping Position
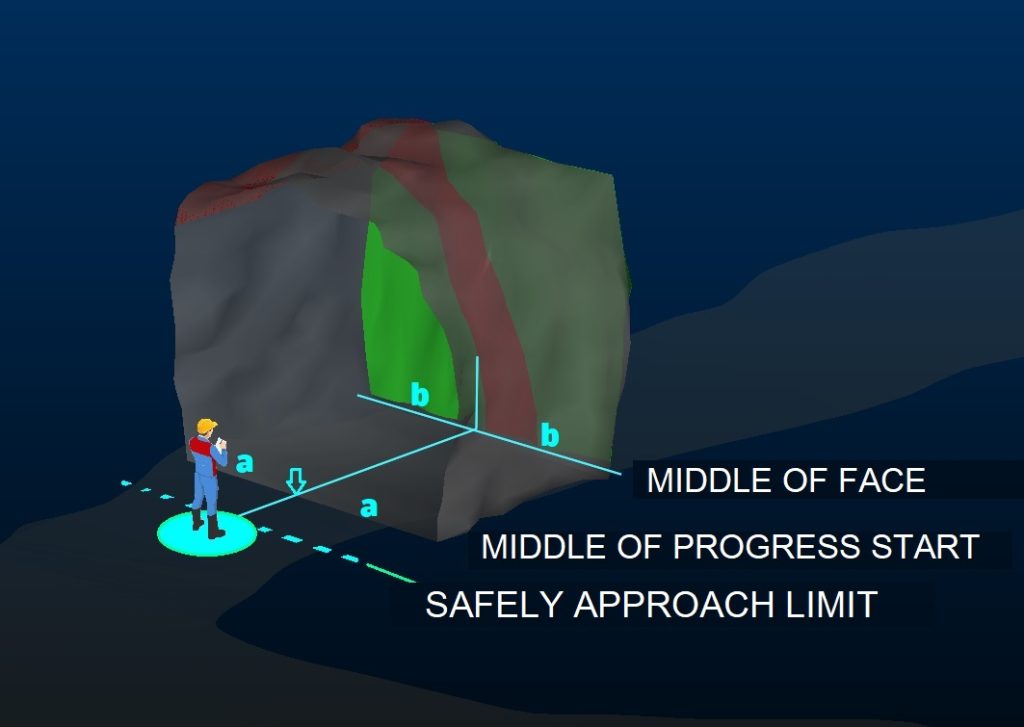
Center yourself in the gallery as close as possible to the plane where the previous progress face was located, in a way that does not pose a safety hazard. If your experience is not sufficient, you can ask your companion for help or use a meter. Aim for the middle point of the last face in your current alignment and determine a focal point with your light as high as your height. Measure the direction (direction) and slope values that you will engrave on the form as the direction of progress with your compass by aiming at this point.
8. Position the Mapping Area on the Form
Think of the progress (ultimate blasted drive) made as an “absolute” cube or rectangular prism. In fact, it would be more accurate to call it the largest prism we can fit into the progress area, which has many protrusions and recesses. We will map all the surfaces of this prism except its base, so let’s designate the resulting front surface as a face. It will be very useful for us to know how wide the focus of our miners lamp is at certain distances, we can measure and determine it in advance at a suitable place and time. In this way, we can quickly calculate the face width by gradually following the reflection of our miners lamp in the face, as well as the ceiling width and the progress on the side walls.
Start by accepting point “0” in the mapping form as the base of the edge where the left wall and the face intersect. In other words, overlap this point on your form with the real one and reflect all other elements on your form relative to this point. Position the mapping area by limiting “ceiling, right and left wall progress” and “all heights of faces and walls” respectively on the template on your form. In this way, you will determine the edges and corner points of the walls, ceiling and face in the underground opening. Let us emphasize the importance of this stage, without forgetting that you will take these limits as a bearing in the next stage. If necessary, you can acquire skills by reading this article from beginning to end many times and practicing it in your room or closed area. Do not forget to enter the face height value in the relevant place on the form.
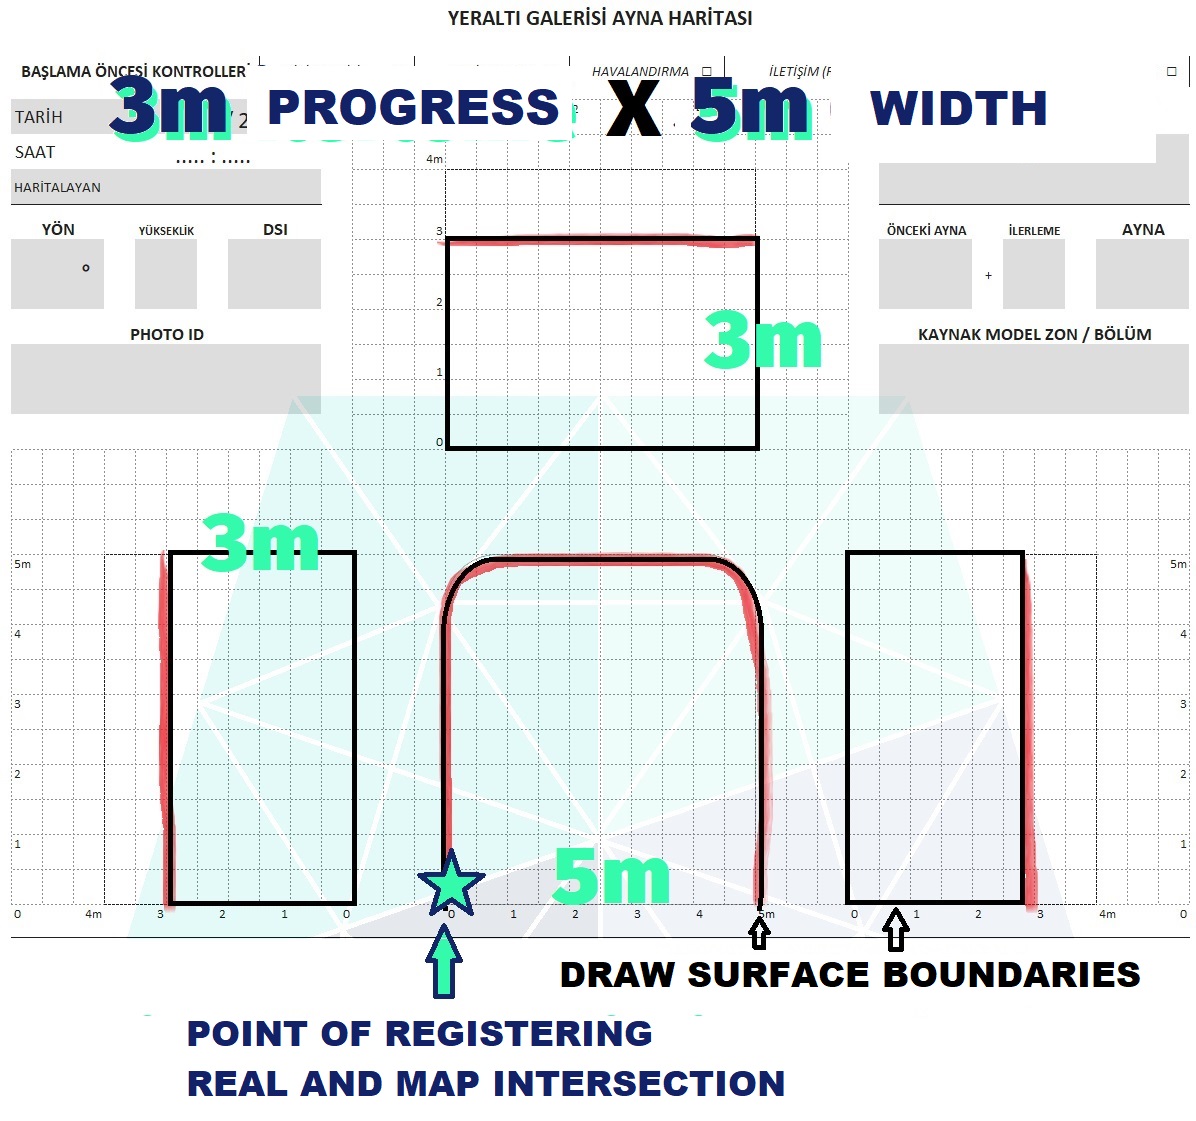
9. Draw Lithology, Ore, Structural Boundaries
Draw and number the lithological boundaries on your map and mark their measurements in numerical order in the structural geology section of your form. While doing this, let’s number the elements we observe on the face, starting from 1, and write their abbreviations in the structural geology section. If these elements are observed on the face, number the structural elements of each type one by one and mark them in the following order.
- Cevher Hanging Wall Contact (HW)
- Ore Footwall Contact (FW)
- Contact of Two Different Rock Types (Except ore lithologies) – Contact (CT)
- Fault (FZ)
- Crack/fracture Trends (JN)

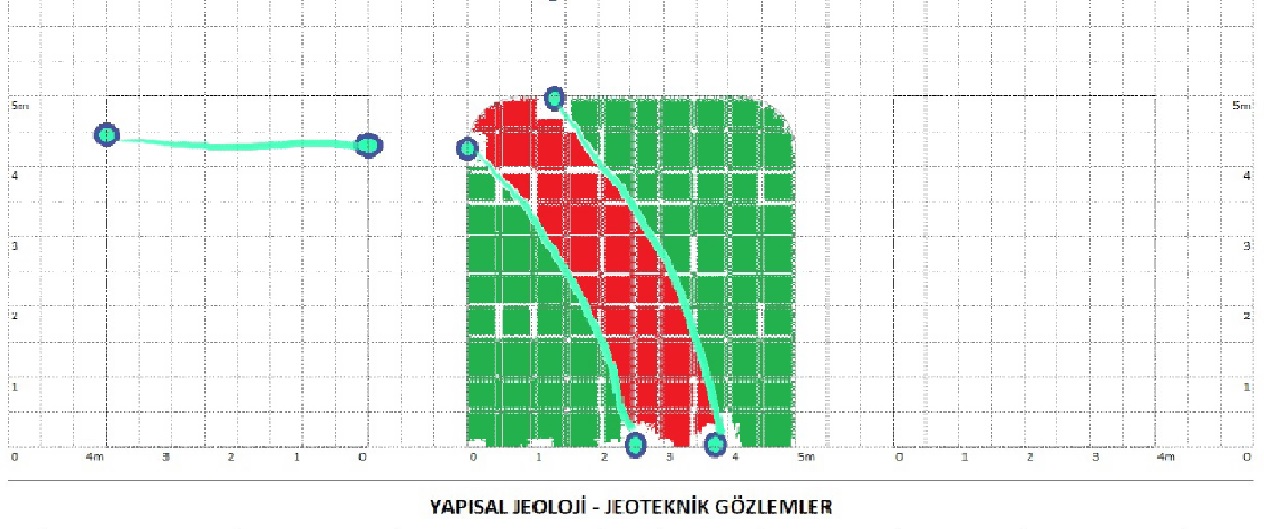
The subject of engineering is mapping, a process in the nature of technical drawing based on calculations. Map the linearity of the surfaces of the above elements that you see in the underground open space, as seen in the areas cut by the underground surfaces. You will put dots on our form to represent the junction edges of the face, ceiling and walls and the intersection of these lines and connect the lines. Follow the structural elements on the underground surfaces with your overhead light, at the point where it intersects the surface edges, measure the distance to the corner closest to the edges (with your overhead lamp, laser distance meter, estimated, etc.)) and put the points by easily determining the distance on your form. You have outlined your points and if there is any undulation or detail between them, combine them by arranging the lines as close to reality as possible. Do not use dashed lines or repetitive scribbles. When you place the pen tip on the form, process the structure in one go, use an eraser if necessary, but do not scribble on the same line. However, if the material in the face (after blasting, etc.) blocks your view or if the blasting has done closed the view of entire contact, use a dashed line. Do not use any unnecessary lines to make your form look full. A simple and confident map is the best data. Write the sequence number on these lines that you have combined on all the surfaces you observe, measure them in the face, and record them in the corresponding number on your form, in your structural observations section. Specify the lithology you see in the area using your lithology codes in the relevant areas between the lines. As you experience this simple method, habits that will come naturally over time will speed up your work.
10. Take Measurements Carefully and Accurately
You can gain the necessary skills within a few weeks by mastering all the instructions and trying them out. By understanding this step, you are complying with your colleagues’ measurements and you are successful, and you will be a strong link in the chain with your “correct” measurements. The elements that you have clearly and confidently processed into the map template have enabled you to have more control over the face. Remember that you will take the most accurate measurement and examine the measured values in your 3D design application in the office. “in nature”, “what you see”, “what you measure”, let’s take consistent measurements step-by-step.
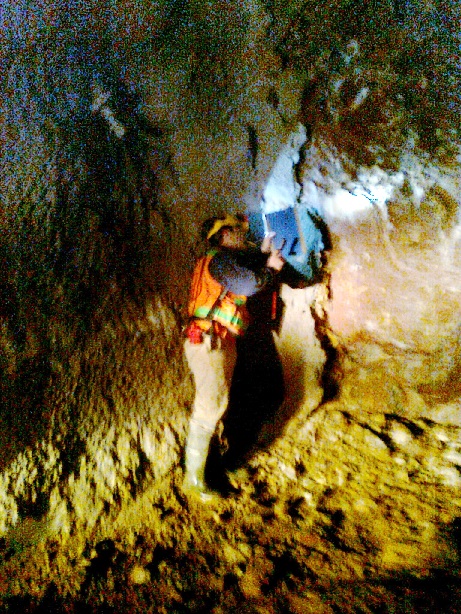
- Look towards the face, take the compass in your hand on the slope direction of the plane you will measure, and your hard clipboard (or a flat, hard surface free of magnetic metal) in the other hand,
- Lift your clipboard up by resting it on your arm or on your wrist, hold it steady with your hand parallel to this structural plane, if possible, align the corners of your clipboard with the linearity in the face, do not move this arm until the reading is finished, check it from time to time.
- With your other hand, lean one side of your compass along the length of the clipboard so as not to separate it,
- Move the compass mirror up and down with your index finger to bring it to a position where you can see the dial,
- Horizontalize the compass by gently sliding it up or down in a circular motion without releasing the entire edge you lean against the clipboard,
- You can decide whether it is horizontal by looking in the mirror and checking the spirit level, if any, or whether the compass needle is horizontal to the compass dial glass or base.
- Read the direction (between 0-180 or 180-360) from the compass mirror, keep in mind, since it is the “direction” you will read, it does not matter which end you choose at this stage,
- Even if you are experienced, lower your arms and repeat reading from zero until the direction value you read is the same 3 times.
- In the same way, fix the clipboard to the structure and switch the compass to inclination measurement mode,
- While reading the direction in this step, remember the compass position you finalized and place it perpendicularly to the clipboard.
- Read slope measurement (0-90)
- Point the compass towards the slope direction of the structure you are measuring and determine whether the slope direction falls in the northern semicircle or southern semicircle (N or S or N or S),
You can write your measurement as “Azimuth” / “Slope Angle” “Slope Direction” in the corresponding line in the structural observations section (Example: 120/45N).
11. Examine Geotechnically and Determine Drive Stability Index (DSI)
Geotechnics in tunneling is a subject that requires expert personnel, responsibility and time, and therefore should be represented by a separate department within the company. If you have the ability to carry out geotechnical monitoring properly, you will have data on many critical issues in your progress, from deciding on the type of fortification to designing gallery plans. World class rock quality classification systems such as Q and RMR are generally used for long-term, civil purposes, fully reinforced tunnel projects. Large exploration and mining companies have aimed to benefit from drilling and progress data on a single formula they created by combining these two systems. Laboratory studies are also required to examine rock quality, so its “proper implementation” is a burden in every respect. For this reason, important reasons are required for it to be on the agenda of mining companies.

In fact, if the main purpose is to achieve relative results by doing a quantitative research, you can do it through the visual records of the geologist who went to the face for mapping, without doing any extra work. You can obtain a numerical value by evaluating each structure and lithology you measured in the previous step under a standard observation with certain criteria and subjecting it to a function. By viewing these values in 3D throughout the mine, you can get a relative idea about the areas where progress has not been made yet, or you can evaluate them for retrospective monitoring or reinforcement/fortification after your progress. These main data, which will be subject to the DSI (Drive Stability Index) formula, will be processed practically under the main headings in our mapping form:
- “No”, the structural or lithology number you have drawn on the template
- “General Surfaces / Structure Selection” (Approval), ceiling stone (HW), base stone (FW), fault (FZ), crack set (JN), mechanical deformation due to advancement (BD), general lithology observed in the face (ES )
- Strike value (N), slope-slope direction value (NA), probability of wedge surface formation (S),
- Combination of surface type and roughness (S), stepped and rough (SR), stepped and slippery (SK), wavy and rough (UR), wavy and slippery (SK), planar and rough (PR), planar and slippery (PK )
- Structural surface infill, abbreviation or code (A)
- The degree to which the structural surface adheres to each other, does not release itself from the surface, and is riveted (Approval)
- RQD (S), the percentage range of blocky rock amount larger than 10 cm in diameter throughout the underground opening
- Degree of weathering (S), fresh rock (FR), moderately weathered (MW), highly weathered (HW), extremely weathered(XW).
- Groundwater observation (S), the degree to which you observe the openness when you map, dry (DRY), moist (MST), wet (WET), dripping water (DRP), flowing water (FLW).
- DSI (N), the values that appear after the above parameters are completed and calculated, enter the calculation result value for the entire span into the DSI cell in the upper left part of the form.
*N: Numerical measurement data, **A: Alphanumeric value, ***NA: Numerical and alphanumeric data adjacent to each other,
****S: Sign indicating the value selected among multiple choice values
After filling out the form in the underground ( at face), when you go to the office, immediately mark your structural data on the formulated form, calculate the numerical DSI value and mark it on your mapping form.
Important Note: The name DSI and its working order are a theory developed by us (GMRTC) as a result of our experiences. This simple study, which does not require any burden, is not a theorem approved/proven as a result of an authority or academic study. Studies on it are continuing and we recommend that you try it to give you an idea and be useful. We would be happy if you share the data you have obtained with us if possible.
12. Photograph the Progress, Get a 3D Offset if Possible
Currently, it is extremely easy to access high-resolution cameras in increasingly smaller sizes. In addition, the quality of the lenses used even in tablets and mobile phones has reached acceptable quality. At this point, the most important issue is that in a completely dark environment, the light is distributed as evenly and at high intensity as possible to all walls, ceiling and faces, instead of a single focus, and that such a powerful light source is portable. The good news is that evolving LED and battery technology makes portable lights with extremely high lumen values possible at affordable prices. Bring all this equipment together, take photos perpendicular to the surfaces (Face, ceiling, right-left wall) and place them in your database with the correct names. This may require a tripod or extension rod for use in an unsupported area.
When the integrated laser distance meter (Lidar) and the existing embedded compass-tilt/accelerometer, which are included in the devices of mobile phone and tablet manufacturers, and the orthographic photography technique obtained by superimposing continuous surface photographs, we can obtain a 3D point cloud. Although this technology has reached useful levels with the increase in the quality of mobile phone cameras, the monthly and annual fees paid for the software used to process photographs (orthophotos) and obtain point clouds are currently a debate. Store the photo-covered/colored point cloud of the progress appropriately in your database if you have facilities enough. Although it is thought that Lidar technology provides an idea for mapping and coloring by taking advantage of the signal delay and intensity coming back from the walls, its consistency can be questioned. Because of factors such as dust and moisture particles suspended in the air, uneven moisture in the rock, dust smeared on the walls and blasting heat, the values provided by the laser beams sent may not reflect the intrinsic values of the rock.
13. Evaluating Maps
We obtained a lot of data through mapping. Let’s evaluate the most important of them one by one.
- Report any unusual situations you observe in the face and believe to be dangerous to the shift supervisor without hesitating.
- If it is not an ore drive face and you decide that sampling is necessary, inform the relevant personel and sample the face at next appropriate time. If a lever, air hammer or similar extra equipment is required for sampling, indicate it in the notes and notify the relevant parties without delay.
- Considering that you are the last person to technically observe the face live, write down on your form any notes needed for further progress. Specify the side where the face width should be reduced and your opinion. Record water breaking or similar unusual situations in your form and note the details.
- You can predict when the major faults observed during progress will appear on other floors and galleries. Therefore, without wasting any time, create and examine the faults that you consider important in our project in a 3D digital environment, and examine whether they extend the surfaces and intersect the drillholes and their continuity. This will show you what you may encounter in other parts of the business plan.
- You identified water-bearing faults, possible wedge surfaces or crushed zones, and recorded this with mapping. You can keep an eye on the possibility of deformation of the fortification in the future.
- With the latest progress, you can estimate the most current position of the ore and the direction it is heading. Using all the data, you can determine the direction and width to optimally include the ore body within the progress section until the next face. Although the direction of the footwall or trend is generally determined according to the last face measurement, it is useful to include the drillings and the model in your evaluation.
- You recorded aside the mineralization behind the walls, on the floor and on the ceiling of the ore gallery. In the future, you can bring them into production by testing these areas with short drilling.
- You can obtain a numerical relative to evaluate it in the drive stability index (DSI) or in the system of your choice. You can use this data to predict your worst-case probability of having problems with the lower/upper floor and side gallery plans.
- If you are keeping level (floor) maps, do not forget to add the lithology you specified in the face base on your map, if possible, after sampling or after finalizing the map.
14. Stop/Pause the Drift Progress, Publish a MEMO
If you are mapping the ore progress, if some unusual situations have occurred or are likely to occur in the yield of the ore within the face section during your observation, call the shift supervisor, inform in front of the face and, if possible, tell the solution there. As examples of special situations,
- Detection of important faults and ex-weathered zones, prediction of water inflow in the form of flow, or informing that important faults are approaching,
Indicating the possibility of dilution while giving the final shape to the face by scraping, declaring to haul the material out of stockpile in order not to contaminate the ore,
If an expansion of the ore is seen in the new face, a request may be sent for a certain amount of widening from the side walls during scraping,The face does not go in the direction you give it to, the face is of a different width than you want,
The ore has changed direction momentarily and lost its optimum position within the drive cut,
Narrowing the drive/face section from certain sides starting from the face in order to keep the mineralization within the section optimally in the next advancement,
Request for extra narrowing of the gallery on the specified axis due to the fact that the mineralization ends in the face or will end in a few meters progress,
The decision to stop the gallery was made after the issues previously discussed in the weekly production meetings concerned the face subject to mapping,
Conversion of the existing face in the ore gallery to grade controlled status (Drive stops if under cut-off result occurs) due to the expectation of a sudden decrease in grade values thereafter,
If sampling is planned on the face, the request to remove surface protrusions on the face which may threaten occupational safety should be submitted before scraping.
15. Preserve Maps, Save the Data Digitally
If possible, after the sampling process is completed, scan the maps in their final form and store them without changing the naming format, in a “mapping folder” that you have determined under the server. Similarly, add face (All surfaces-drive) photos or 3D scan files and photos. Create a “map recording” file (Table/Excel file) in the same folder and, if possible, design it considering visuality and ease of access. Your purpose with this file is; To facilitate your work in many subjects such as modeling, grade control, reporting, agenda setting, geotechnical and access all data with shortcuts through a single portal. Entry in one line for each map;
- The face from which the map is made; name, progress length, width, height, direction (perpendicular to progress),
- The center of the face or the base coordinates (X, Y, Z) where the wall measured in meters intersects the face,
- The ore zone code you used in modeling (domain, zone, vein etc. titles),
- Mapping date and time, map makers and accompanying persons,
- The DSI (Drive stability index) value you have calculated,
- If done, the face sampling average and the grade given to the face material,
- Link to a photo or 3D scan file, or a link to a wireframe file with a picture overlay that you have created,
Determine column headings to enter data such as above. By transferring data from this file to your design program, you will be able to use it in many areas. If you have made a 3D scan, import them to your folder in a format suitable for your project, or create face surfaces in your 3D design program (Wireframe, solid body), cover them with map photographs and save them to your project. To ensure error-free records, staff your shift system accordingly. You can folder and archive the printed versions of your maps that you have used completely digitally.
Pay Attention - Recommendations for Staff at All Levels
Record all your findings on your form in the underground, “in front of the face” and complete the mapping there. Do not plan to keep anything in mind and write/draw it later, you will most likely forget it in the dynamic process. Headings that will be calculated in the office (DSI etc.) are excluded from this warning.
Choose your compasses from the practical types with movable dials that are available in the product range of almost every brand. Since you will constantly use the compass mirror and aiming mechanism, it will make your work much easier and faster.
As we do for the beginning of any geology project, make corrections for all shift and personnel compasses for “needle” deviation that occurs specifically for the type of projection you will use in the digital environment. To do this for the first time, in the simplest form, ask your survey staff to read the coordinates of 2 points 10-20 meters away from each other in a clean planar area. Measure the directions of these point coordinates in the computer program you will use or get them from surveyors. With all compasses, read the directions of the 2 stakes and correct the differences and calibrate them.
When making your maps, definitely use pencils. If the humidity in your business is high or there is water coming from the ceiling in places, print your mapping forms from laser printers (or photocopiers) rather than inkjet printers. Water, mud, etc. You can prevent the ink from smearing in the areas that come into contact with it. Interestingly, even when you wash the forms that have fallen into the mud with water and dry them, the area you drawn with the pencil in your document and the laser ink are not deformed.
If you are not familiar with mineralization or have just started your career, whenever possible, examine your ore model in a 3D digital environment and analyze the ore body. Pre-processed faults in your spare time; Examine your decline, ramp or underground plans on the project screen, along with your production (Asmined) offsets if possible, it will be very useful. Take over the lithology (ore) status from the previous face map, predict the lithology you will see. Your training process will take time, if possible, ask your experienced shift mates to check the maps you made and note your mistakes in your notebook.
When you have time, compare the lithology, ore, degree of alteration, faults, other structural elements and crushed zones that you have observed in the galleries and, if possible, photographed in detail, with your drilling logs and photographs in 3D on your project screen. This unique opportunity to compare professionally with mining geologists will provide you with great experiences that many of your colleagues will not have. This experience will help you effectively evaluate your new drillings for the project that will be started from “0” or in areas where there is no progress. Constantly follow your drive offsets (production maps) and drillhole data in digital environment, and do not be deprived of the opportunity to encounter your drillholes meters underground.
In the training given by experienced personnel, continue the training process until the compass measurements of the new personnel differ by 1 degree (direction 360°, slope 90°). Compass measurements are not based on interpretation at all; those who imply or claim this should be re-trained and observed until they are calibrated with all shift personnel. Measurements made by different personnel, fixed by experience, can be made in a standard manner and consistent results can be obtained. You can replace the compass you are using with a more practical model, and be careful to take measurements from corners away from the metal parts of the hard clipboard.
You do not have to map and take samples at the end of every drive progress / before all drill-blast process, but it is beneficial to do so. You should set a standard with the experience you will gain from the underground production process, based on the commodity you operate and its homogenization within the ore body or vein structure. This standard process is essential for you to establish order between shifts.
Remember that you are measuring the structure you will measure over an underground surface of several meters square. Considering that there may be small undulations even at this scale, you should measure the surfaces you will create with the apparent points you consider from the longest intervals. Remember that you will extend these measurements in a digital environment and expect the result of this extension to be consistent with its outlines, even if it is not the same as in reality.
In order to establish your mapping standards, interpret your maps and manage the entire ore production and resource modeling process, it will be beneficial in every aspect to consult an expert at any stage, especially at the beginning of the process.
Making your folder in the server in a system as mentioned above will provide you with full control over the mine. The faster and easier you access data, the more data and parameters you can evaluate together, which contributes to an exponential increase in your data dominance. You can transfer data from your mapping table file to your design program and view many 3D coordinated data. You can draw your faults in 3D and easily control structural elements database. By performing a temperature model via DSI, you can re-evaluate your gallery plans and similarly examine the average grades of the lower and upper levels. For this reason, you can add data titles specific to your business to the file during the process.
When saving all files that require you to use face names, such as photo, “wireframe”, 3D scan, write the face meter after the “+” at the end of the naming in 3 digits as standard. For example, use A300W+015 for the 15th meter of the A300W gallery, or B200E+009 for the 9th meter of the B200E gallery. It will be beneficial for you to keep the standards intact so that you can automatically pull them from your database in the applications you will use.
If there are specific distinctions for your mineralization, try to reflect this in your drilling log column titles with the experience you have gained, because underground progress is the best drilling. Use the same dictionary (same list) for the lithology codes and other similar parameters you use, ensure consistency.
Switching to full automation in mining production in the very near future is no longer a dream. If the aim is to produce ore, we can say that the basic element that automation will need most is the “ore model closest to reality”. It should not be forgotten that no data acquisition, including drilling, can replace the experience gained through underground and open pit mapping-sampling during the production process. Your entire mapping database, which is kept clean and easily accessible, will ensure that you get the closest values to reality when updating the model.
Unfortunately, new beginnings in mining projects are always problematic, and the continuation of well-known mistakes makes the job even more difficult and causes many important elements to be overlooked. It will be very useful to get support from an expert for underground mapping, have your current process checked and create an effective system for the final product “ore model”.
Mapping is the basis of the grade control program in underground mining operations; It is the most important assistant in resource and reserve modeling and model updates.
Knowing that your staff has this procedure in print in your company or “written” somewhere in your file network and that they are responsible for this procedure will play a leading role in ensuring that work is done in an orderly and disciplined manner. Considering the geological processes in mines as a whole and reviewing this procedure again, regardless of your level and experience, will be beneficial in every aspect.
“Underground Geological Face Mapping”, in our article you will find the whole procedure step by step. Especially hydrothermal and massive sulphide deposits, with commodities gold, nickel, silver, copper, lead, zinc, iron, and some other metallic commodities are in a need of systematic surveillance. Underground geological mapping is essential for grade control, production and modeling in narrow vein deposits, however you can adapt this guide for any of your underground operations.
Subjects discussed in this article may overlap with your mineral exploration, modeling, mining operation and business development issues and may provide solutions for those. However, remember that various factors specific to your business may bring about different challenges. Therefore, seek support from expert consultants to evaluate all data together in order to convert potential into profit most efficiently.
Should you have any questions regarding the articles or consulting services, please don’t hesitate to get in touch with us.

GMRTC Mineral Exploration & Modeling & Operation Consultancy
Istanbul - Izmir - TÜRKİYE
SITE MAP
CONTACT US
Before quoting or copying from our site, you can contact info@gmrtc.com
All elements (texts, comments, videos, images) on the GMRTC website (www.gmrtc.com) are the property of GMRTC unless otherwise stated, and are published to provide insights to interested investors, professionals, and students. Any detail that may arise during your process will affect the subject matter you are interested in on this website; therefore, GMRTC (www.gmrtc.com) is not liable for any damages incurred. It is recommended that you consult experts with all your data before making any decisions based on the information provided.
