Resource Model & Production Grade Discrepancy Investigation
You plan the production volume you will make from underground or open pit and calculate the volume of the actual excavation. Grade estimation is made to represent each block (unit mass) in the model you plan and produce. This primary estimation is the proportion (grade/quality) of material in the “dry mass” obtained from drillhole cores and other samples. The density (SG) and moisture content of the masses represented by these blocks, which are assigned the grade you will produce, are different. Naturally, the grade amount you assign by calculating from the model or taking a weighted average from your sample after production will not reflect the whole mass. This difference is directly related to your ore grade / quality or the density of the minerals carrying the metal. Unfortunately, you may have overlooked this.
Familiar Dialogue.
[Process] -We need to raise the feed grade 🤔
[Mine Planning/Production] -We can’t get the grade we planned! 😤
[Mining Geology] -Wait, model will catch up soon 🙄 (At least, best wishes)
[Resource] -See you on Monday. 😇 (Don’t urge people on Friday afternoon)
[“Ordinary” Colleague] -Knowledge is knowing a tomato is a fruit; wisdom is not putting it in a fruit salad.😎
(Well, the last one is not related to our topic.)
(Closing): Since you will not be able to see more grade values in the model than the grades you have determined by drillholes, while the production continues, the zones where grades are higher than the model indicates will “heal your wounds” and… Stay safe until the next scene.
So what could have happened in deed?
Let’s examine this with examples representing 2 different structures. It will be beneficial to first read the commodity you are working on and then start over to avoid confusion.
Additionally, you can explore the related articles listed below.
WARNING: After this stage, you may experience confusion and difficulty in following. Starting from the “Solutions” section at the bottom, getting an idea and then reading all the details if necessary will help you achieve more efficient results. Remember that it is absolutely beneficial to have an experienced modeling/resource geologist review your project, taking into account the elements mentioned in this article.
1. "Gold" (Au) Example
The production of commodities such as Ag, Ni, Co, Cu etc. makes difference due to relatively low grade production and gangue mineral density:
- You have produced 100 cubic meters in open pit or underground, and when you calculate your average on-site density (SG) value as 2.5 t/m3 , you have 250 tons of material in your stock area.
- You plan to get a value of 5 g/t Au by taking a weighted average from the model or by channel sampling, or you are going to assign this grade to your production.
- According to this tonnage and grade you calculated, you should obtain 1250 grams of Au as a result of 100% efficient processing of the mass.
- The (SG) value will vary significantly in the region where you make this calculation due to factors such as porous structures in the ore formation, the amount of clay and fracture within the ore, the tightness of the quartz or gangue mineral, which varies in proportion to the grade, and the involvement of the altered host rock in production. The difference will be increased from the density value you accepted.
- Zone A: Assuming that the actual density value is 2 t/m3; If the grade you will plan / assign remains the same, you should extract 1000 grams Au metal from 250 tons (With constant density) of ore (100 cubic meters x 2 [sg] x 5 [grade]/106).
- If we make the calculation from the metal obtained (1000 g) with the density we consider to be average (2 t/m3), we should have planned/assigned a grade of 4 g/t Au instead of 5 for 250 tons of ore.
- Zone B: Assuming that the actual density value is 3 t/m3; If the grade you will plan/assign remains the same, the metal you need to obtain from 250 tons (with constant density) of ore is: 1500 grams Au (100 cubic meters x 3 [sg] x 5 [grade]/106).
- If we make the calculation from the metal obtained (1000 g) with the density we consider to be average (3 t/m3), we should have planned/assigned a grade of 6 g/t Au instead of 5 for 250 tons of ore.
Hydrothermal alteration, porous / vuggy crystallization and active faulting may cause your ore to fracture or contain dominant clay. Since the clay content will be in a loose and void structure rather than a hardened rock, there will be density differences.
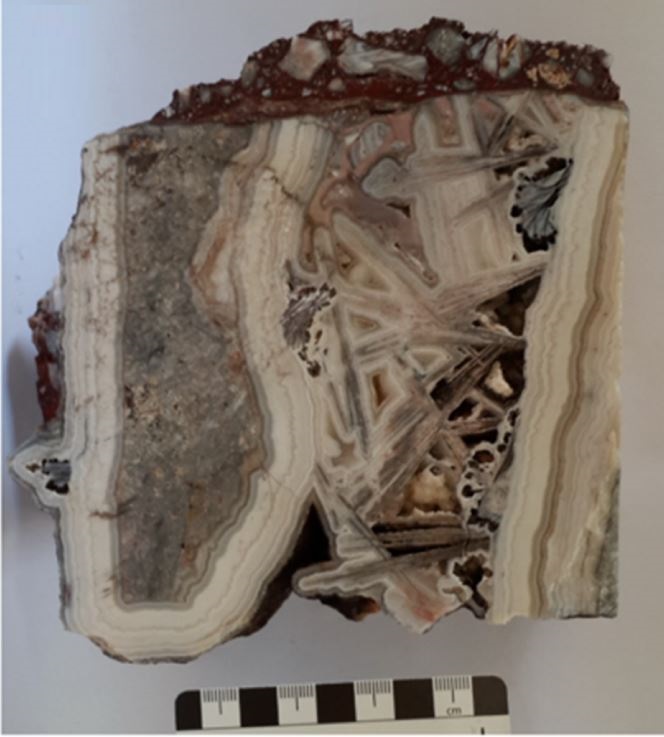
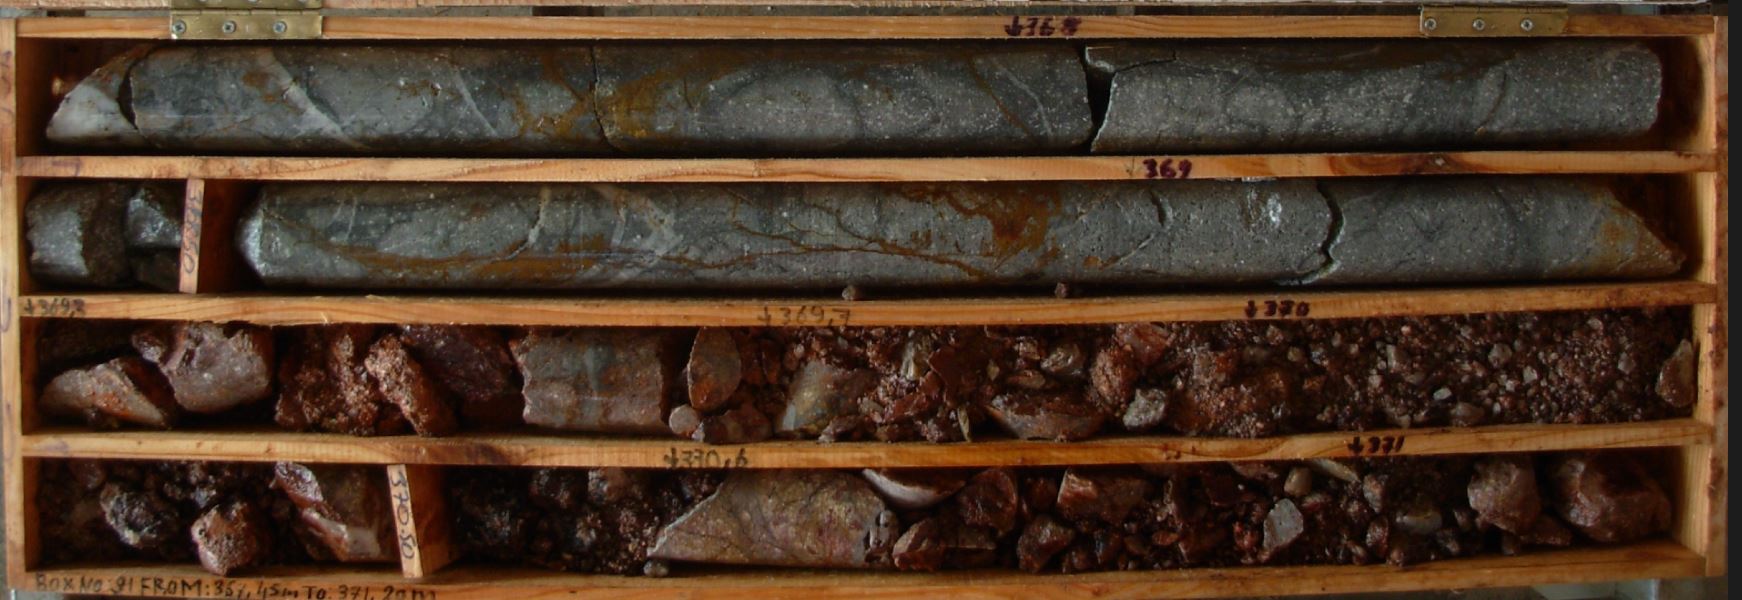
The hand specimen in the photo belongs to an epithermal mineralization and was obtained vertically at a depth of approximately 380 meters below surface. We can see gaps between the lattice bladed and within the comb textures developed around the colloform and cockard textures. If we consider that we have obtained drill core in regions where the main ore structure is formed with these textures, or as in this hand specimen, we can see these voids need to be filled before measuring the “volume” of the mass in order to calculate the density.
2. Lead / Zinc / Copper (Pb/Zn/Cu) Example
Production of relatively high grade (%), such as Cu, Pb, Zn, Fe, Al, Cr, Sb, which makes a difference mostly due to production and ore mineral density (Should be considered as polymetallic):
- You have produced 100 cubic meters in open pit or underground, calculated average “resident” density SG value of 3 t/m3, you have 300 tons of material in your stock area.
- You plan to obtain 5% Pb-Zn grade value by taking a weighted average from the model or by channel sampling, or you have assigned a production grade/quality value accordingly.
- According to this tonnage and grade you calculated, you should obtain 15 tons of Pb-Zn as a result of 100% efficient processing of the mass.
- The (SG) value will vary significantly in the region where you make this calculation due to factors such as porous structures in the ore formation, the amount of clay and fracture within the ore, the tightness of the quartz or gangue mineral, which varies in proportion to the grade, and the involvement of the altered host rock in production. The difference will be increased from the density value you accepted.
- In addition, the fact that metallic ore minerals with high density directly affect the total density to a certain extent will cause the difference to increase in a positive or negative direction.
- Zone C: Assuming that the actual density value is 2.5 t/m3, if the grade you will plan/assign remains the same, the metal you need to obtain from 300 tons (with constant density) of ore is: 12.5 tons Pb-Zn (100 cubic meters x 2.5 [sg] x 5 [grade]/100).
- If we make the calculation from the metal obtained (12.5 tons) with the density we consider to be average (2.5 t/m3), we should have planned/assigned 4.2% Pb-Zn grade instead of 5% for 350 tons of ore.
- Zone D: Assuming that the actual density value is 3.5 t/m3, if the grade you will plan/assign remains the same, the metal you need to obtain from 300 tons (with constant density) of ore is: 17.5 tons Pb-Zn (100 cubic meters x 3.5 [sg] x 5 [grade]/100).
- If we make the calculation from the metal obtained (17.5 t) with the density we consider to be average (3 t/m3), we should have planned/assigned 5.8% Pb-Zn grade instead of 5% for 350 tons of ore.
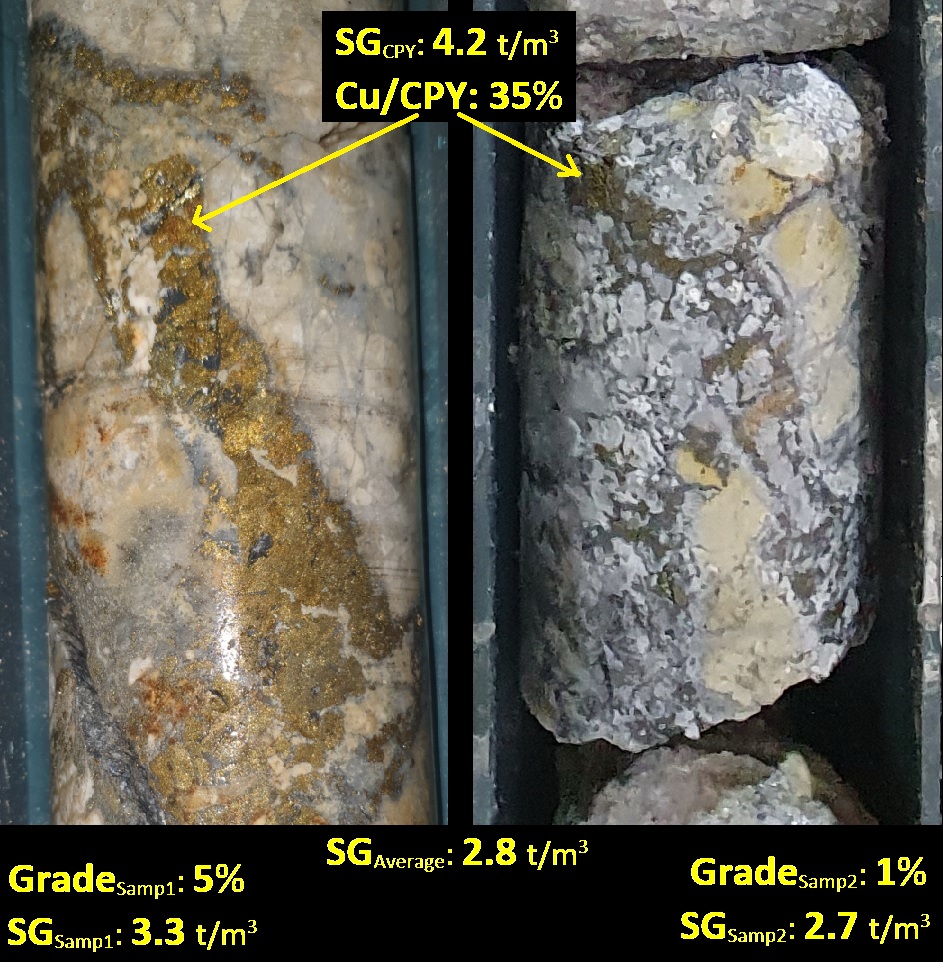
The example for copper or similar metals is not discussed here as it would take a more complicated process. We can summarize by stating that the diversity of ore minerals causes this, because the Cu ratio in chalcopyrite and the Cu ratio and mineral densities in chalcosite, covellite, bornite in copper mineralizations are different. The amounts of chromite and iron in the chromium sample will create similar proportional differences, and mineral clusters containing silica, magnesium and aluminum will also pose problems in terms of density in some places.
Starting Investigation
In the examples above, based on possible assumptions, it can be seen that there will be more than 15% differences in either tonnage or grade. This difference may accumulate as supplies are made and production is added to stocks. When feeding is done from high grade areas of the stocks, it is assumed that the grade is compatible and the problem is thought to be solved, but when feeding is started from relatively low grade areas, the reality will be faced.
This difference may widen or close even more in high grade (HHG or HG) ore stocks or low grade (LG) stockpiles, but it is possible that we do not understand this. Chaos may occur as a result of problems whose source you do not know.
The above examples are only examples of problems caused by the in “resident density” value. Highly variable “humidity” (or moisture) rates will be added as another parameter. In addition, this humidity rate will change before entering each weighbridge, likewise after each pouring, and also during rainy seasons, dry seasons, sun exposure, the bucket diving too deep into the ground during loading, dust and flying… Don’t say it’s not that much, these will happen if you are recording shipping and more than one stockpiles.
As the scenarios branch out, they require control and monitoring within a certain system. First of all, ensure the density determination, the rest are processes that need to be developed specifically for your business, so it is best to hold meetings and get consultancy according to your needs.
What is "SG"?
“Freed from moisture”; specific gravity, specific gravity, density. Density without moisture where excavated, density in situ, resident density.
What is "SG" not?
Stock density, bulk density, loading density, density in the truck bed.
Why are "SG" and Moisture Determination Necessary?
All samples you give for grade determination will first go into the oven and the analysis results will come based on dry tonnage. You can only measure the “ton” value of the trucks you pass through the scale (the reliability level for belt scales is debatable). Apart from this, the masses will be represented by the volumes obtained by survey personnel as a result of mapping the excavation carried out in the field, in the stocks or underground by taking points. The humidity value will be different at each stage. Therefore, in order to calculate the amount of metal in any mass, you need to know the analysis result as well as its “density” and “dry” tonnage to convert its volume into tonnage. You need to calculate your stock density for your stocks, regardless of the subject.
How is made: "SG Test"?
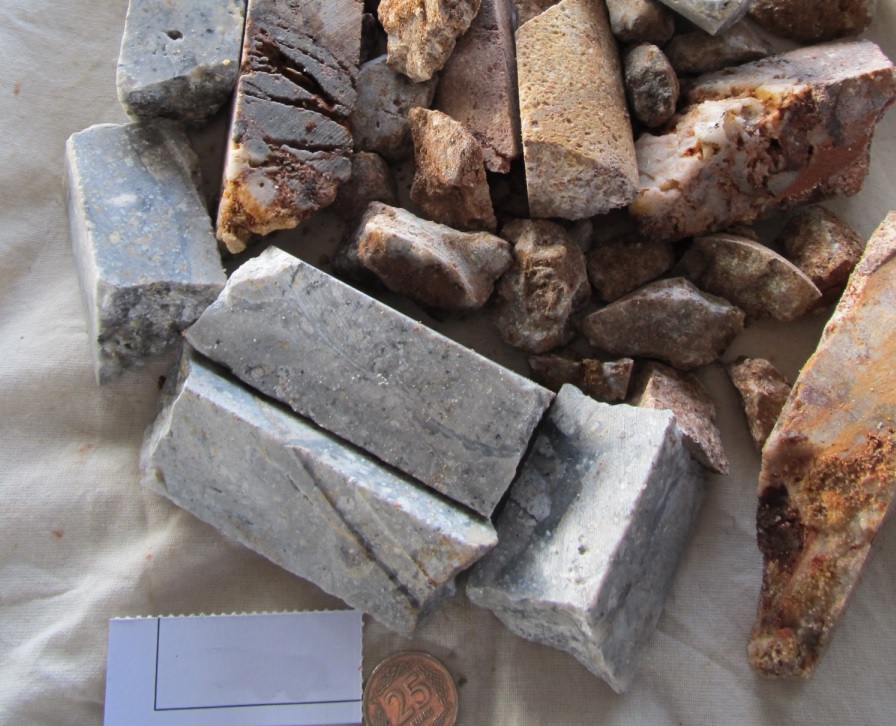
It is carried out by determining the weight of the liquid to be used or directly the volume and mass of the core, using the “Archimedes” principle of buoyancy. The easy method is to add pure water (density 1 g/cm3) to a certain level of the graduated (volume) container, and a 10 centimeter long full or half core obtained from the selected drillhole interval is cleanly measured on a precision scale and entered in the form. The measured core is covered with wax, if any, sample fractures and gaps are filled with wax in accordance with the instructions, or the broken samples are joined and plastered in accordance with the instructions. The sample is placed in a graduated (volume) container, the volume is determined from the level difference and entered in the form. “SG” data is calculated in an “excel” file with formulas and saved in the database. The measured samples are meticulously photographed and recorded.
"SG" Test Samples Selection and Considerations
SG testing for ore body is generally performed on samples taken from the intervals where drillholes intersect average and high grades. Therefore, along with metallic minerals, the samples will also contain gangue minerals whose density is relatively higher than the “general average”. In addition, it should not be forgotten that since it is done on a point basis rather than a cross-sectional sampling of the entire vein, it may also represent average and relatively lower grade sections.
Beyond general and traditional assumptions, test “SG” rigorously and frequently. After the geologist selects the areas to be sampled for this relatively low-cost test, you can quickly get the results of these tests by giving the job to an experienced sampler or intern.
Select core samples, if possible, at least one or more from each drillhole. While checking the drillholes, examine the ore lithology with a list of intervals which grade values intersected. Mark and list mineralized intervals for the “SG” test, taking into account mineralogical differences. If the ore structure changes in same drillhole or if more than one zone is passed, apply the “SG” test at different intervals in the same drillhole. Geologist’s interpretation and an experienced eye are essential in sample selection, and notes can be taken while performing the geological log.
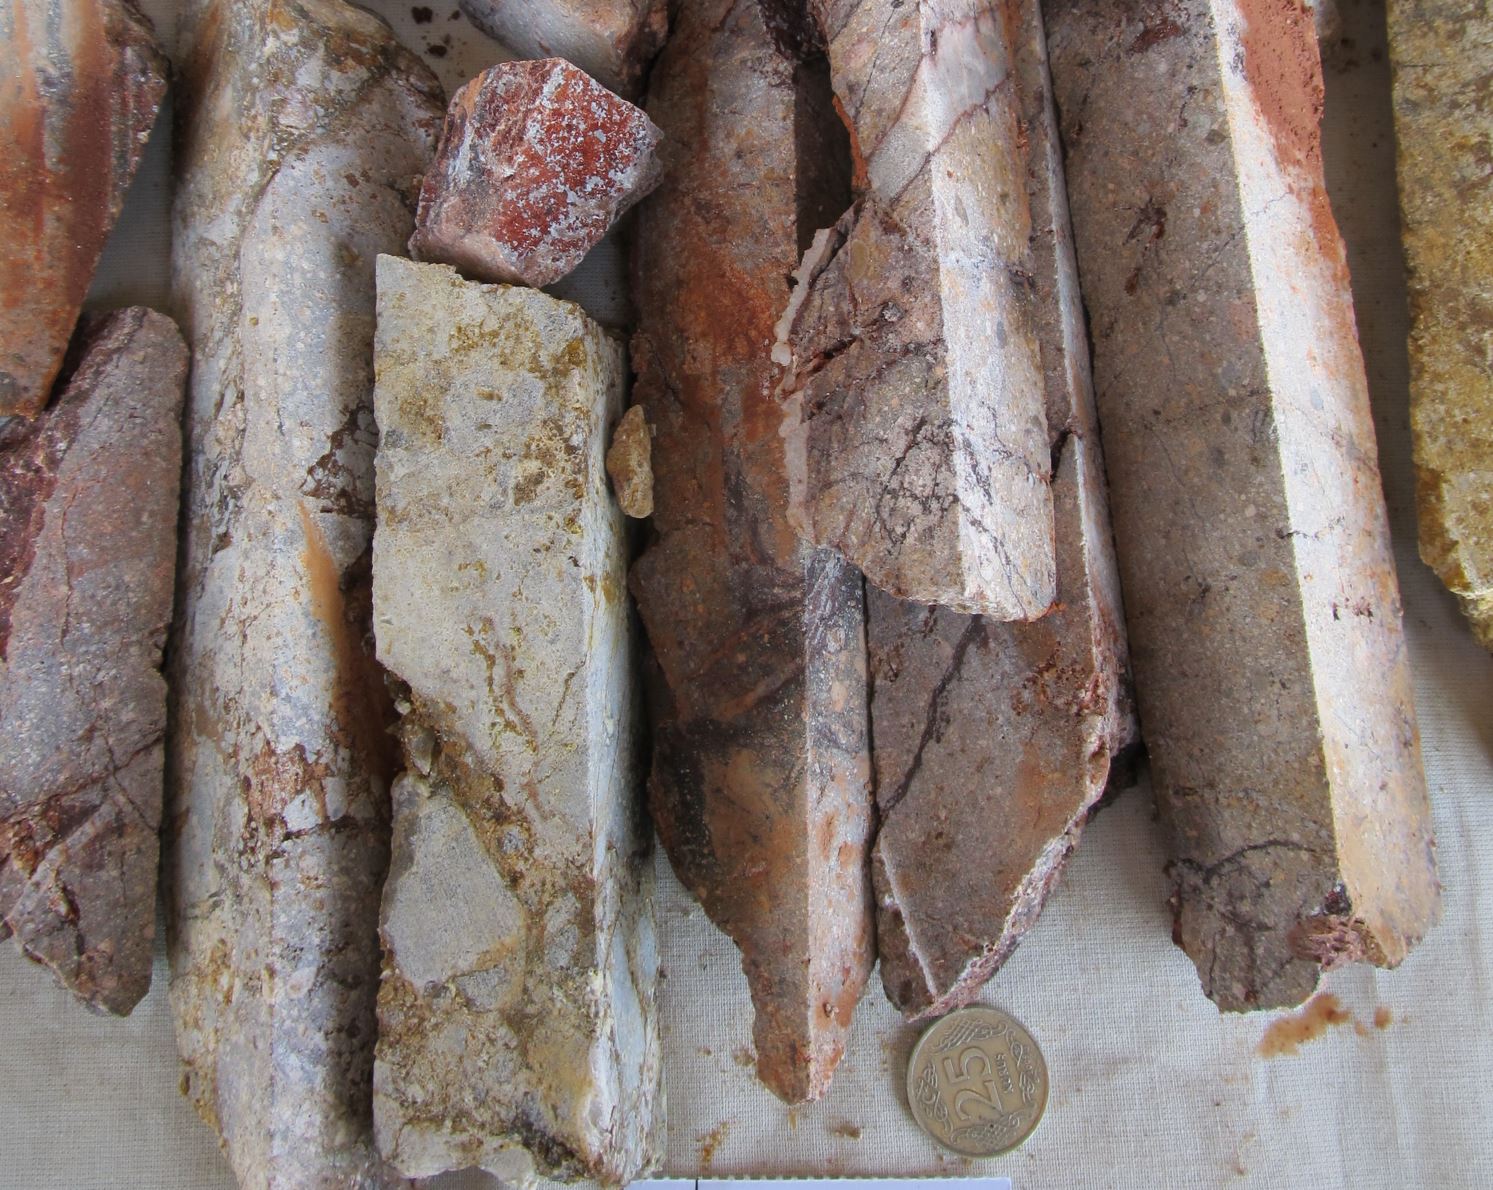
There will be cavities/cavity structures in ore minerals or gangue in underground. Similar fractured structure, fault, layer and void filling ore bodies can also be observed frequently. Do not feel like you will only do your density sampling on “full cores”, on the contrary, determine and sample intervals from structures with fractures/voids. Before taking “volume” measurements from samples with fractures and/or void structures, ensure that the samples are represented within the absolute cylindrical inner tube.
For example, you will take measurements from a full core sample, fill the cracks and gaps in the sample with wax to preserve the cylinder geometry. Likewise, if you are going to use half or quarter core, fill the gaps correctly. Join the samples in the fractured ore zones within the core casing, parget them with wax in the most realistic way and measure them. Otherwise, your sampling will lead the entire process in the wrong direction.
Note that there will naturally be gaps between the alteration minerals in the table, especially the argillic alteration clay grains, so there will be a serious decrease in the density of rocks containing such alteration clays.
In addition to their density, the high element ratio in the mineral will increase the density differences. As tonnage increases, this situation will become more noticeable. There will also be disputes between departments regarding production/plan grades.
SOLUTIONS
We must calculate the “SG” value for each block in a different column, like the grade columns in the block model (resource model). When calculating this, we need to get as close to the real thing as possible, so compared to the production we can choose the most appropriate one from 3 different methods: experimental, theoretical and hybrid. The aim is to determine the effective density (ESG) for each cell / block.
A. Experimental
Estimate “SG” in resource model with frequent sampling over more drillholes. This will create a unique effective density (ESG) value for each block in the model. It will be especially useful for low grade deposits. If you regularly note your gangue mineral (quartz or silicification) in your drillhole logs, you can additionally formulate the effect of silica on density.
B. Theoretical
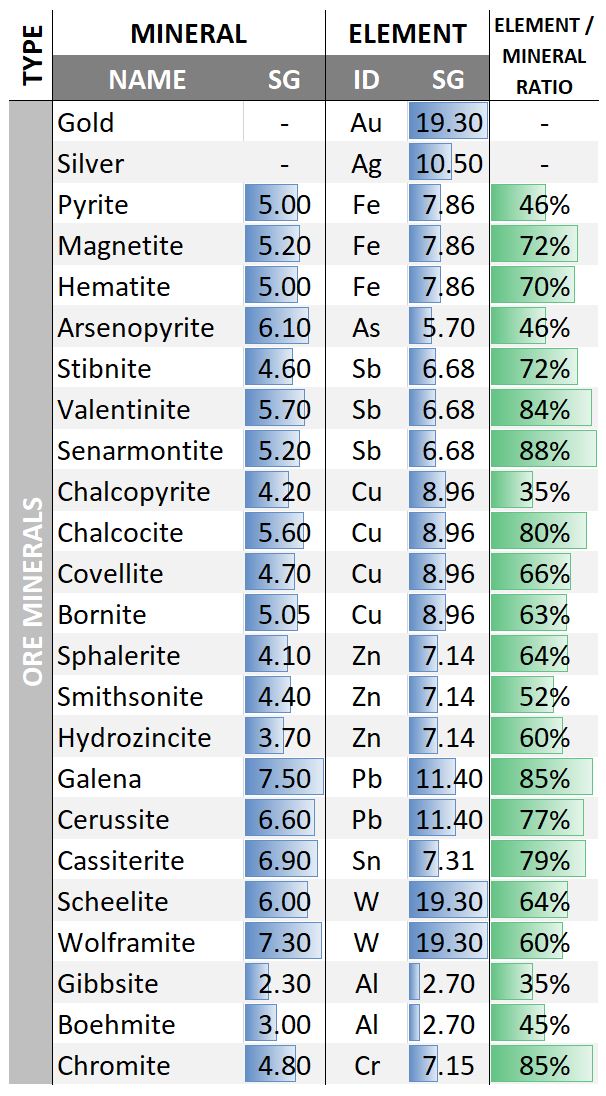
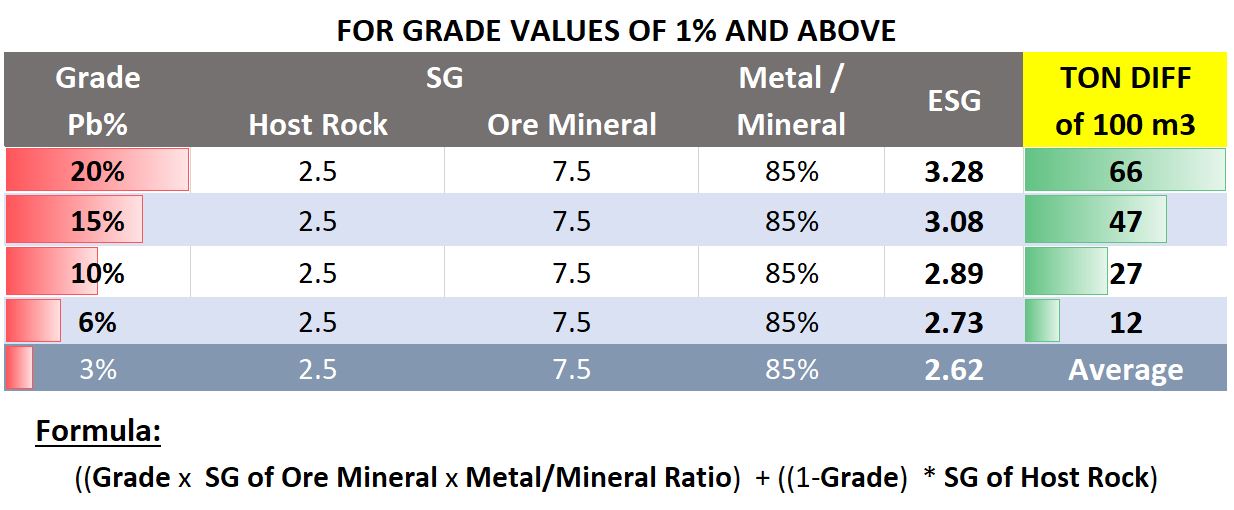
For each block in your model (in each row), you can obtain the effective density by multiplying the “coefficients you obtain from the ore/gang mineral density and the element content of the mineral” with the grade value in the same row. To calculate these coefficients, you can review the table above according to your mineralization experience and preferences. You can see serious differences in deposits with minerals containing high amounts of metal. You can examine the Pb example and the formula that can be used below. To avoid confusion, the sample was calculated based on Pb only. Pb-Zn or Ag, Cu, Mo, etc. when parameters are included, it will be necessary to evaluate polymetallic elements with their equivalent coefficients specifically for your project.
C. Hybrid
After creating your “SG” column in your block model file by making predictions with the “experimental” method, you can get closer to absolute reliability by creating an “ESG” column with the “theoretical” formula you apply to each row. When planning production or assigning grade to production, we can reach the closest result to reality when we need to take the weighted average of the mass and grade values of thousands of blocks out of millions in the model. Compared to the past; Computer programs are more efficient and usable, processors and hardware are capable of processing millions of lines of data quickly, and equipment and testing costs are reasonable. In order to determine accurate and consistent constants, it will be useful to choose the most appropriate one of these studies and consult your modeling and resource geologist or an expert.
Note 1: Analyzes of ore samples are always carried out on “dry mass” basis. Don’t forget to take moisture measurements in your stocks! Otherwise, problems arising from density differences will be replaced by problems arising from humidity.
Note 2: Do not forget that there will naturally be gaps between the alteration minerals in the table, especially the argillic alteration clay grains, so there will be a serious decrease in the density of rocks containing such alteration clays.
Note 3: In commodities such as gold and silver, where ore is produced on a gram per ton (ppm) scale, you should take into account the gangue minerals or the density of the total rock.
Note 4: Do this at the beginning of the project, or ask someone who is familiar with “excel formulas” to add the existing SG file format to your analysis result page, otherwise it may be difficult to write the SG file one by one manually.
Note 5: As mentioned above, let us underline once again that polymetallic elements will need to be evaluated specifically for your project with their equivalent coefficients and recovery values.
Note 6: The abbreviation “ESG” is not used as the signature of a respected geologist named Ercan Süleyman, but as an abbreviation for “effective specific gravity”. However, the abbreviation “ÖS”, which is frequently encountered in our other articles, is not used as the signature of a respected geologist named Özgür, represents “end of sample”. And the abbreviation “KÖ” refers to the “Importance of the Subject” rather than the signature of a respected geologist named Kaan.
Subjects discussed in this article may overlap with your mineral exploration, modeling, mining operation and business development issues and may provide solutions for those. However, remember that various factors specific to your business may bring about different challenges. Therefore, seek support from expert consultants to evaluate all data together in order to convert potential into profit most efficiently.
Should you have any questions regarding the articles or consulting services, please don’t hesitate to get in touch with us.

GMRTC Mineral Exploration & Modeling & Operation Consultancy
Istanbul - Izmir - TÜRKİYE
SITE MAP
CONTACT US
Before quoting or copying from our site, you can contact info@gmrtc.com
All elements (texts, comments, videos, images) on the GMRTC website (www.gmrtc.com) are the property of GMRTC unless otherwise stated, and are published to provide insights to interested investors, professionals, and students. Any detail that may arise during your process will affect the subject matter you are interested in on this website; therefore, GMRTC (www.gmrtc.com) is not liable for any damages incurred. It is recommended that you consult experts with all your data before making any decisions based on the information provided.

