Line and Channel Sampling in Mineral Exploration Field Study
Comprehend the vital significance of sampling all mineralization phases on outcrops and gathering rock samples sensibly for mineral exploration studies.
Your goal: To be able to indicate that "There is plenty of this here" for the rock you sampled
You have obtained a license or are in the process of evaluating the property (license), perhaps you are in the operation phase and carrying out a grade control program. Near and within the field boundaries, you have identified either an ancient working (dating back to ancient times) or a group of tracer mineral deposits in a particular area. Perhaps the colorful minerals that have always attracted human attention in nature took you to this region. You want to document the amount of the mineral or element you think is valuable by making a sampling. Naturally, the sampling you do on the surface at your expense must have a purpose. You should claim that the rock you sampled is a resource by saying “there is plenty of it here”, or on the contrary, if someone comes to you with a project, you should hear about it and somehow question the reliability of the data. When the chemical analysis result of rock sampling comes, you need to make comments such as positive, negative, or indicative. To do this, you must either be able to calculate the mass it represents, or systematically obtain a relative with other samples.
Additionally, you can explore the related articles listed below.
You need to question what benefit a selective / concentrated sample of ore minerals that constitutes mineralization will bring to you. If there is a more reliable sampling than drill core among the data used in projects, it is line sampling performed by human hands perpendicular to the true thickness, with the same logic.
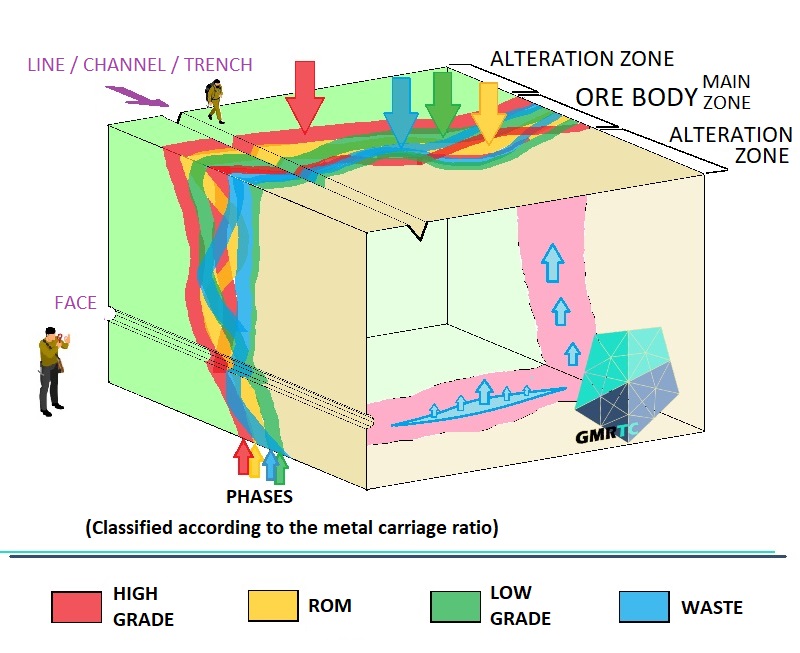
“We define line sampling as the whole of the systematic continuous sampling at intervals you specify along a linear line whose direction does not change or changes, where you use names such as “ground sampling, wall sampling, face sampling, trench sampling, channel sampling, slope sampling”.
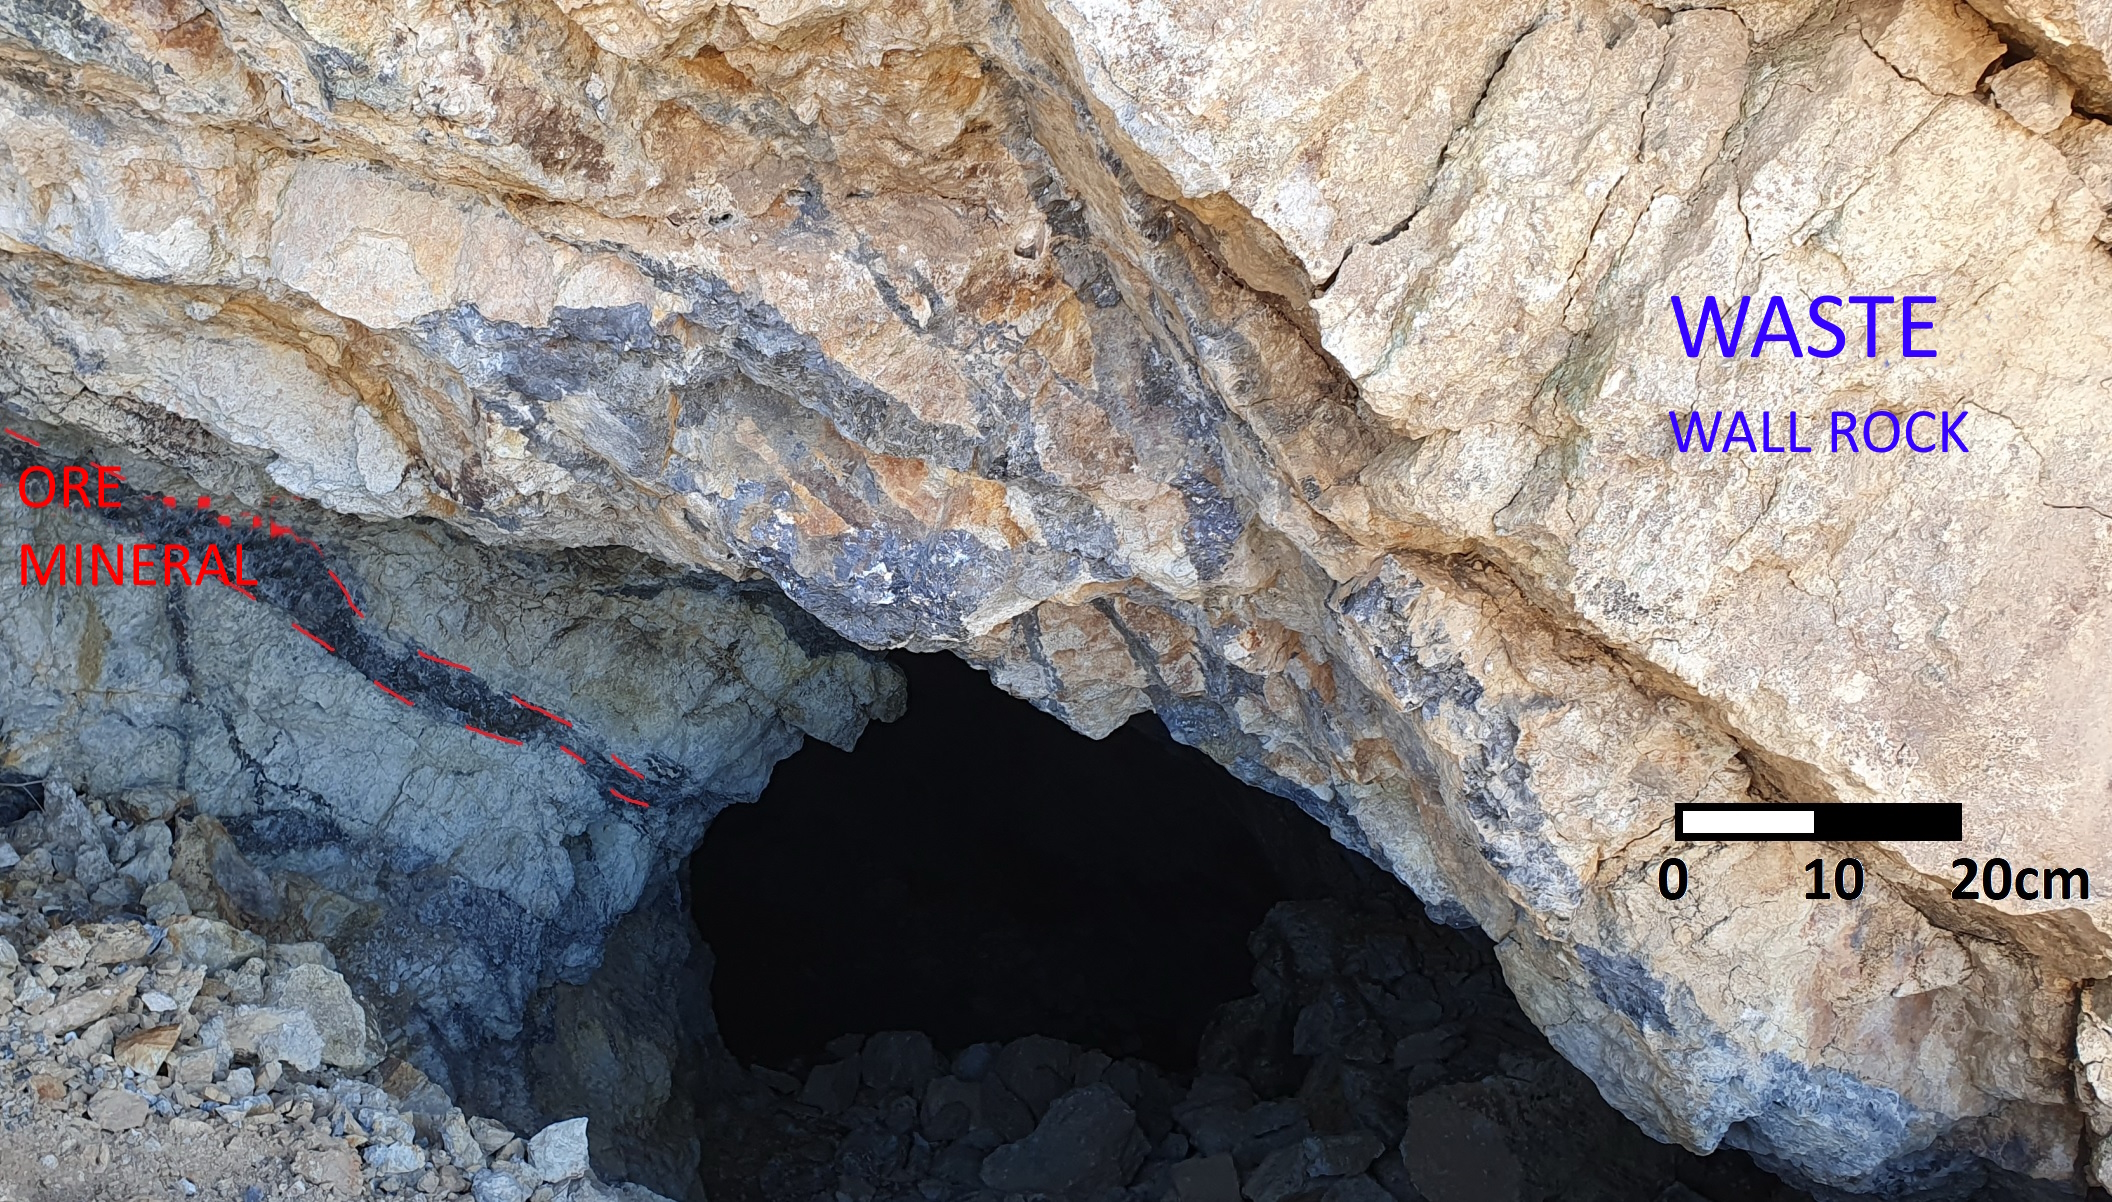
Metals are generally enriched primarily in the form of sediments (volcano-sedimentary) on the sea floor by settling in hot water (Hydrothermal) cavities or coming out of volcanic vents (A group such as chromium, platinum group, etc. are excluded). You will determine the metal settlement of whichever phase is dominant at the point where you took the sample. Although we generally base the distinction on textural and visual features when distinguishing them in the field, we also need to consider that these phases may be pierced by other phases and that it is quite difficult to follow them.
When these hypogene (deep) mineralizations are decomposed and transported to another place by surface or shallow conditions, supergene and secondary enrichments are formed. It will be very useful to have an idea about the origin of the mineralization you will study so that you can examine the formations and take samples from the right points. We will not go into details under this topic, but it is important that you first accept a concept that will serve as your main basis for many issues in the later stages of your project. Line sampling needs to be done at every stage, you will start from a point with the data you have, and as your concept approaches its reality with the data obtained over time, your working directions should change dynamically. The steps below are not a exploration workflow diagram, but rather work that you need to finalize as much as possible to ensure proper line sampling.
Decide on Mineralization Type
There are ore classifications based on many criteria. You can start by questioning whether your mineralization is primary or secondary in origin and move on to the detailing phase. Most of the time, the work required to obtain temperature and salinity values is postponed to later stages of the project. Fluid inclusion, dating or isotope chemistry studies are costly and time-consuming. By collecting information such as cross-cutting relationship, host rock identification, and determination of general mineralization types observed in the region through literature review, you can determine preliminary assumptions for the origin relatively visually.
By examining the formation models of the mineral group that you believe to be an ore body, you will begin to form an idea about the settlement geometry and direction. By considering the directions you have obtained at this stage, you can note them as a parameter to decide on the best sampling line.

Mark up Structural Elements to Your Map
Examine the field, based on plate tectonics on a regional scale. Evaluate morphologically or general assumptions in the literature and note the forces causing deformation and possible main shear zones on your maps. Make comparisons with your expectations and after by going out into the field. Create a structural measurement file and, if possible, obtain elements such as types, coordinates, strike-slope-slip. If you are not at the detailed study stage, you can put everything you have on the table and continue with the steps.
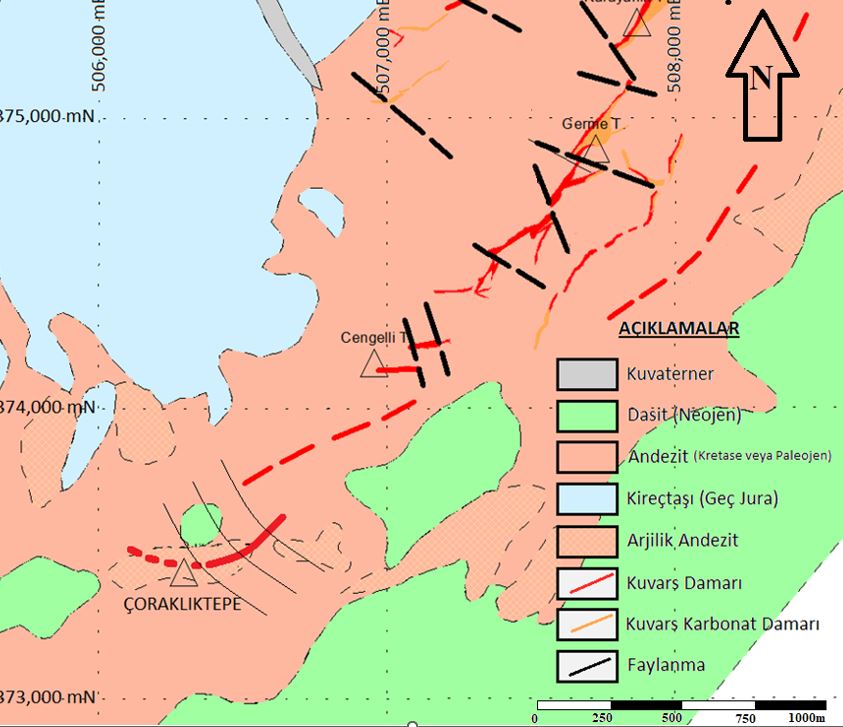
You worked in the field, scanned the literature, examined the morphological layers in aerial photographs and updated your map or project through 3D design programs to master your field. Try to decide which structural elements are ore mineralization and which are final shaping. You should be careful about the sampling direction at the points where you detect the slip on the mineralization, because you may obtain misleading results by sampling parallel to the mineralization in order to cut the faults perpendicularly.
Distinguish Alteration Zones
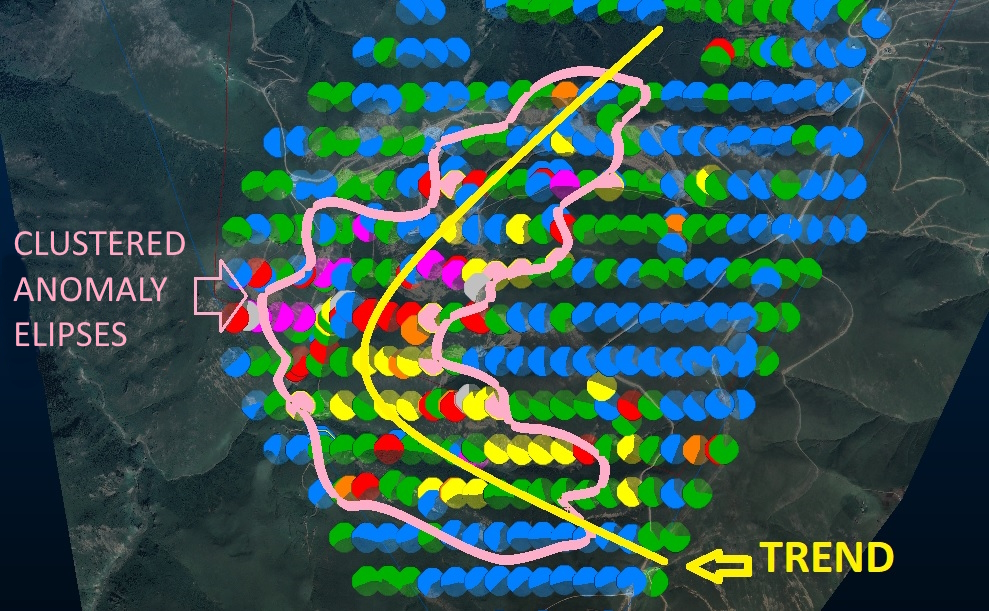
If you can mark up the alteration areas in the field and note the degree of alteration, take plenty of macro and general photographs and take notes on your map. In addition, if you can track alteration with remote sensing, include these in your project in the same way. Considering all the data and the mineralization you have decided on, a direction if possible; better yet, when you look at it as the crow flies, try to identify horizontal ellipse or similar shaped anomaly areas. As in every step, enter the data you obtain and the directions where the ellipses extend into the common project or map.
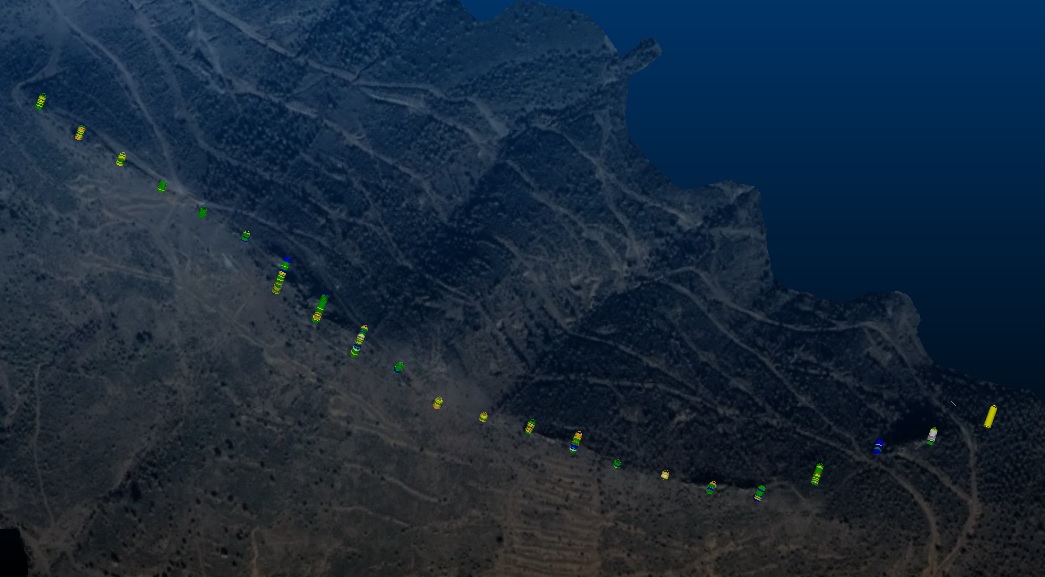
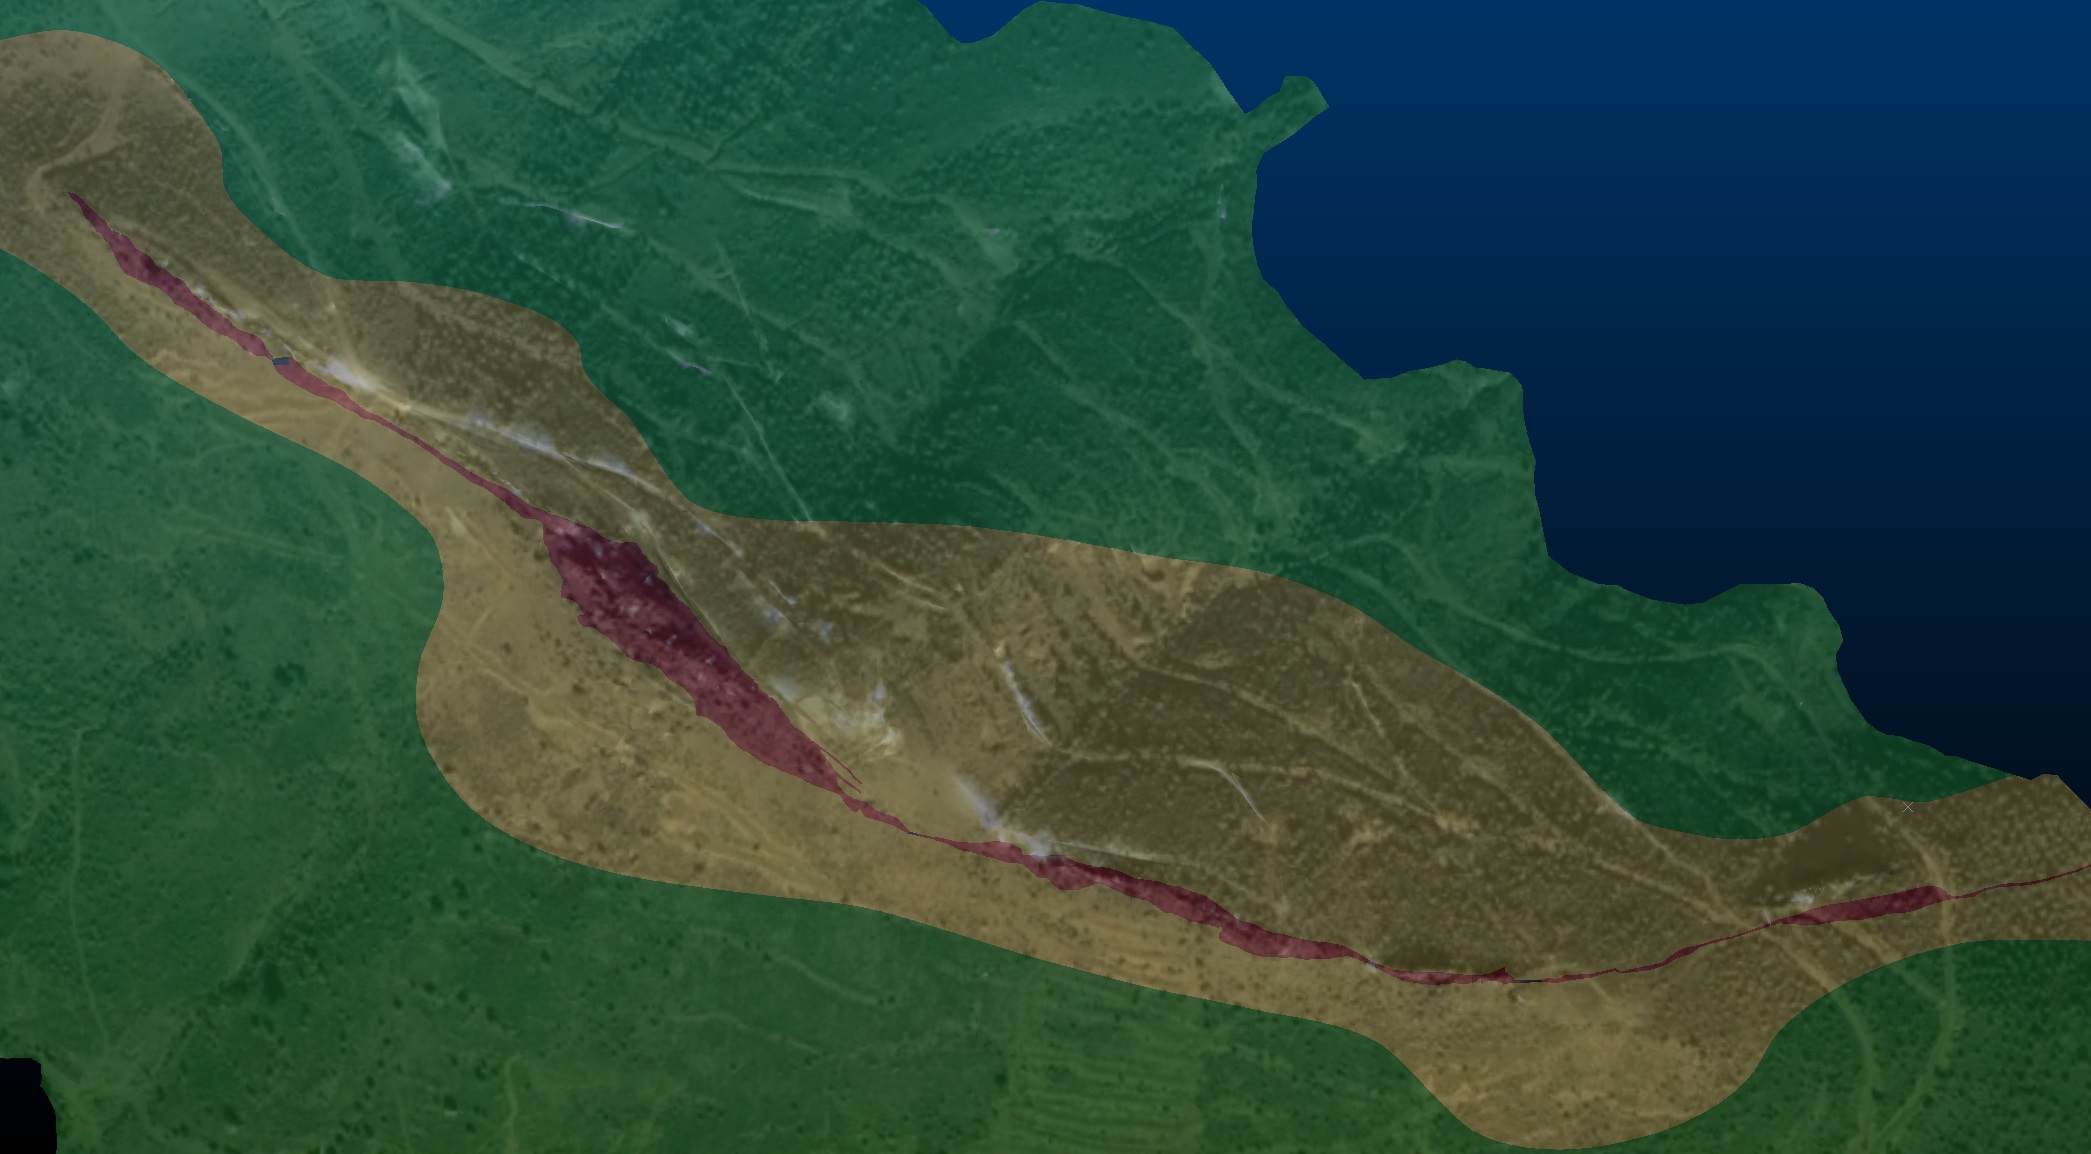
Alteration will surround the ore rock at different levels on a very large regional scale. Extension in a certain direction will be in the direction of mineralization, you can detect this by drawing it on the map. Even if you cannot detect ore body on the surface, you may need to take samples on alteration rocks.
Obtain Anomaly Directions from Other Sampling Data
If you have previously made line samples, indicate their directions and the analysis results in your project/map. If possible, examine the values to determine the horizontal anisotropy.
As a result of this review, you can update your line directions. Additionally, you can evaluate your systematic soil sampling anomalies in the same way you do in distinguishing alteration zones. Using all the details such as topography and soil formation, you can clarify the center lines you obtained with accurate statistics and anomaly analysis and include the working directions in your project.
Identify Lines Directions Perpendicular to Main Mineralization Trends
Consider the horizontal section as trends, whether mineral-bearing fluids have reached the surface during mineralization or not. We can think of these extending trend channels as parallel ellipsoids. Of course, it is not possible to describe its real state in nature with geometric shapes, what we do here is to consider the closest thing to reality with some assumptions.
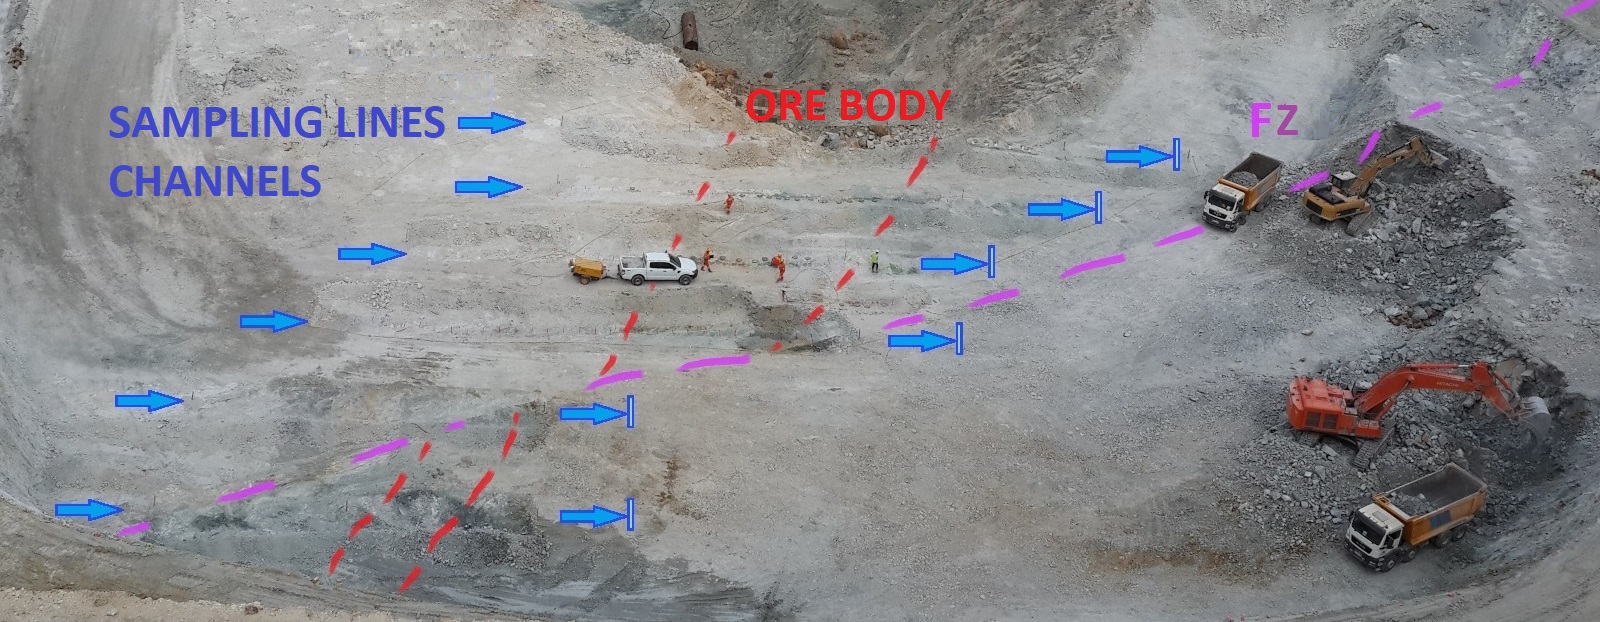
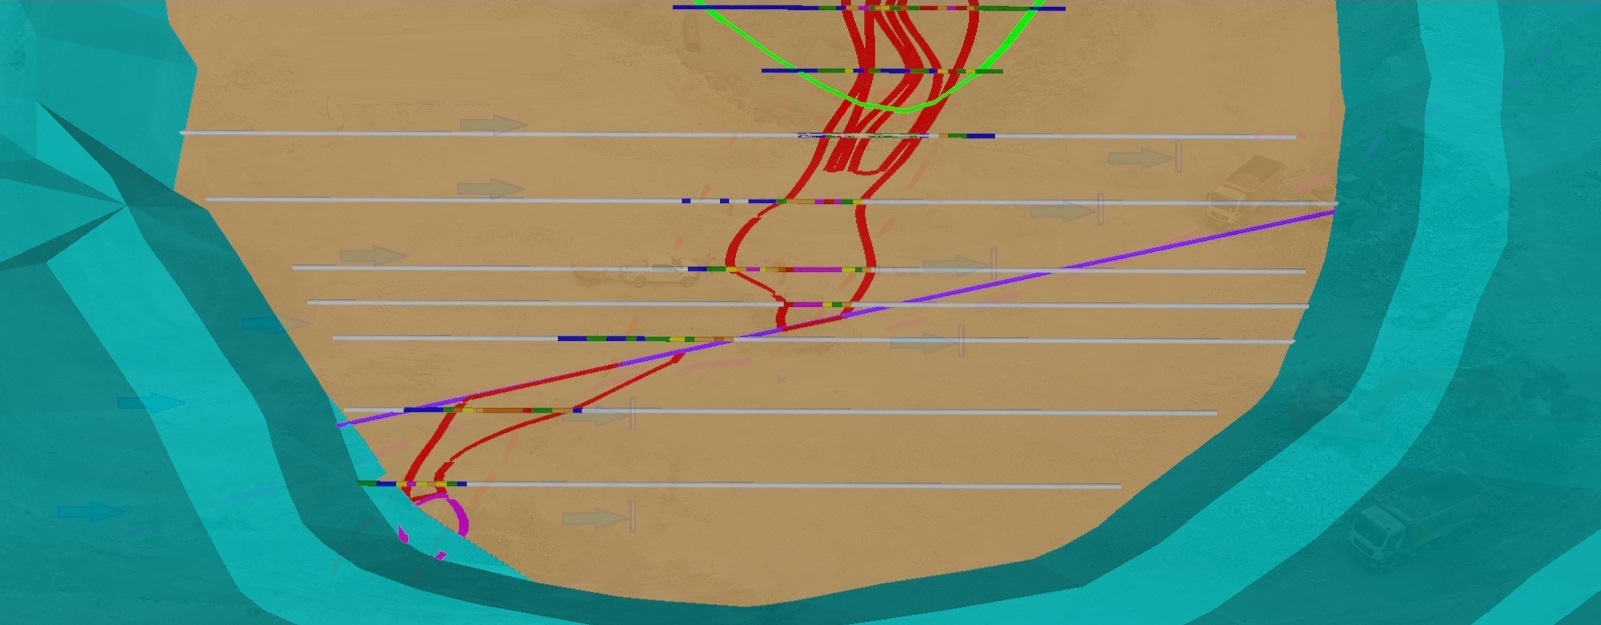
Try to unveil a data accumulation of what we have done in all the above steps on the project/map, and clarify that the center line of the accumulation is our trend direction. You should consider the direction of your line sampling as perpendicular to the nearest trend values whenever possible. You will be able to use the most up-to-date directions obtained in your work in all exploration and drilling stages.
Sampling Mineralization Based on Trend Directions
On a form or sheet; enter the coordinates where you will hit the first hammer for sampling, the start-end values of the intervals you divided along the line, the direction and inclination of the sample interval, sample numbers, lithology and the titles of other elements you want. You will fill in these headings one by one for each sample. You can scrape off lines with an excavator in a direction perpendicular to the trend line, you can proceed by digging a trench, and you can reach the fresh surface with the excavation process you want. You can sample your surface, which you have scraped off and, if possible, cleaned by blowing air, by dividing the intervals on the sample line with spray paint, starting from the ceiling stone of the trend line. You can reach some useful pape under related topics in Open Pit Grade Control sampling.
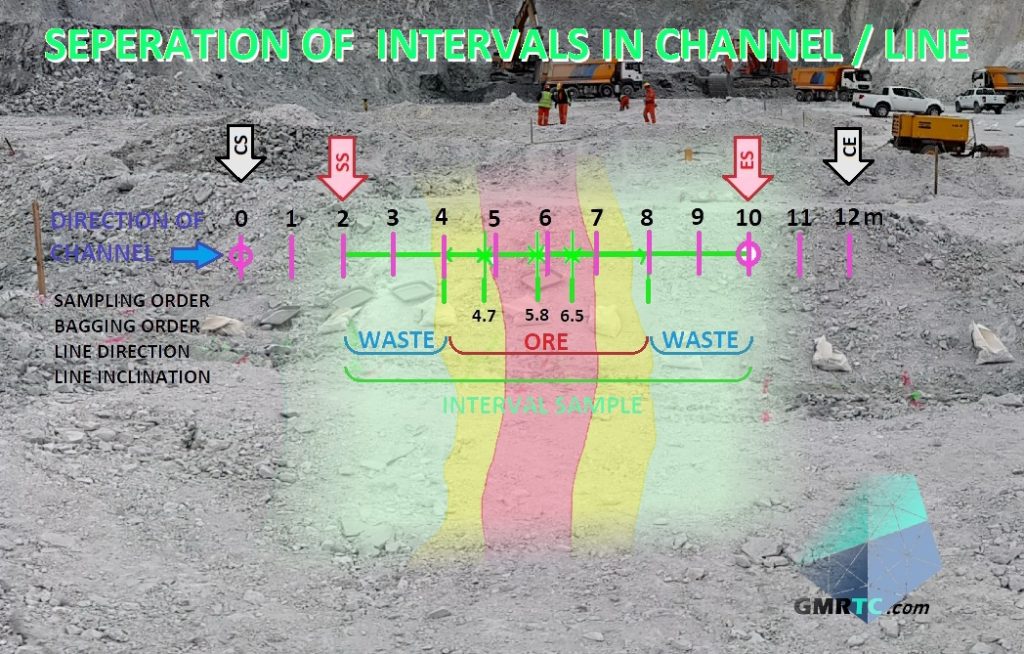
You should choose a starting point within the waste rock so that you will see a few “0” examples before reaching the main ore structure or the structure you expect value from. Likewise, after removing the ore, continue the line until a few samples are taken from the waste/wall rock. Enter the sample intervals, sample numbers, lithology, directions and slopes of all the intervals in the lithology that you divided along the line between the point you selected and the point where you will finish the sampling, on your record form. If your line always continues in the same direction, it will be sufficient to note a single direction-inclination value. If you have knowledge of mineralization geochemistry, you can make a division by taking this into account, otherwise you can make a division by distinguishing lithology.
First divide lithological and specific differences. Separate the areas inside and outside this specific range into optimum widths of 1 meter, maximum width of less than 1.5 meters, minimum width of more than 0.3 meters. Carry out a self-controlled sampling with a conventional system together with your samplers.
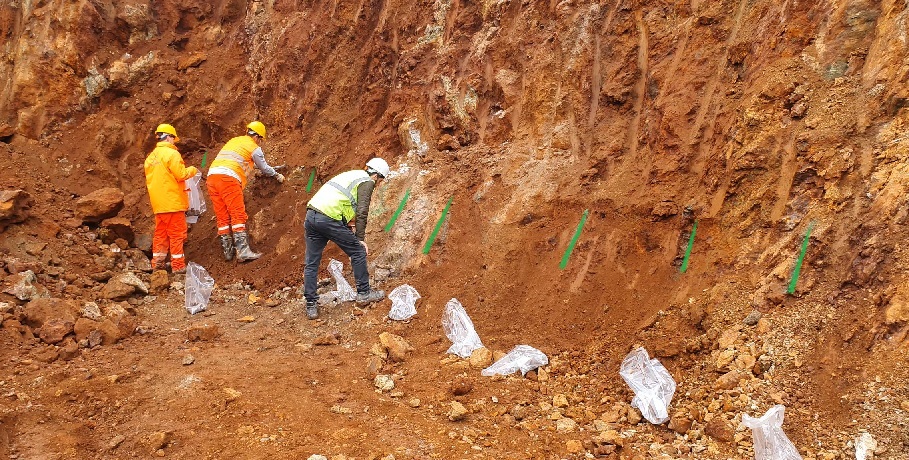
Enter your line sampling log regularly under the headings created in a form like the one below. Digitize and save it to a file in server when you are back to office. Your headings, data columns can be changed throughout your project along with your data needs, it will be useful to determine this form or the key data that needs attention at the beginning of the project.
Choosing Lab Studies
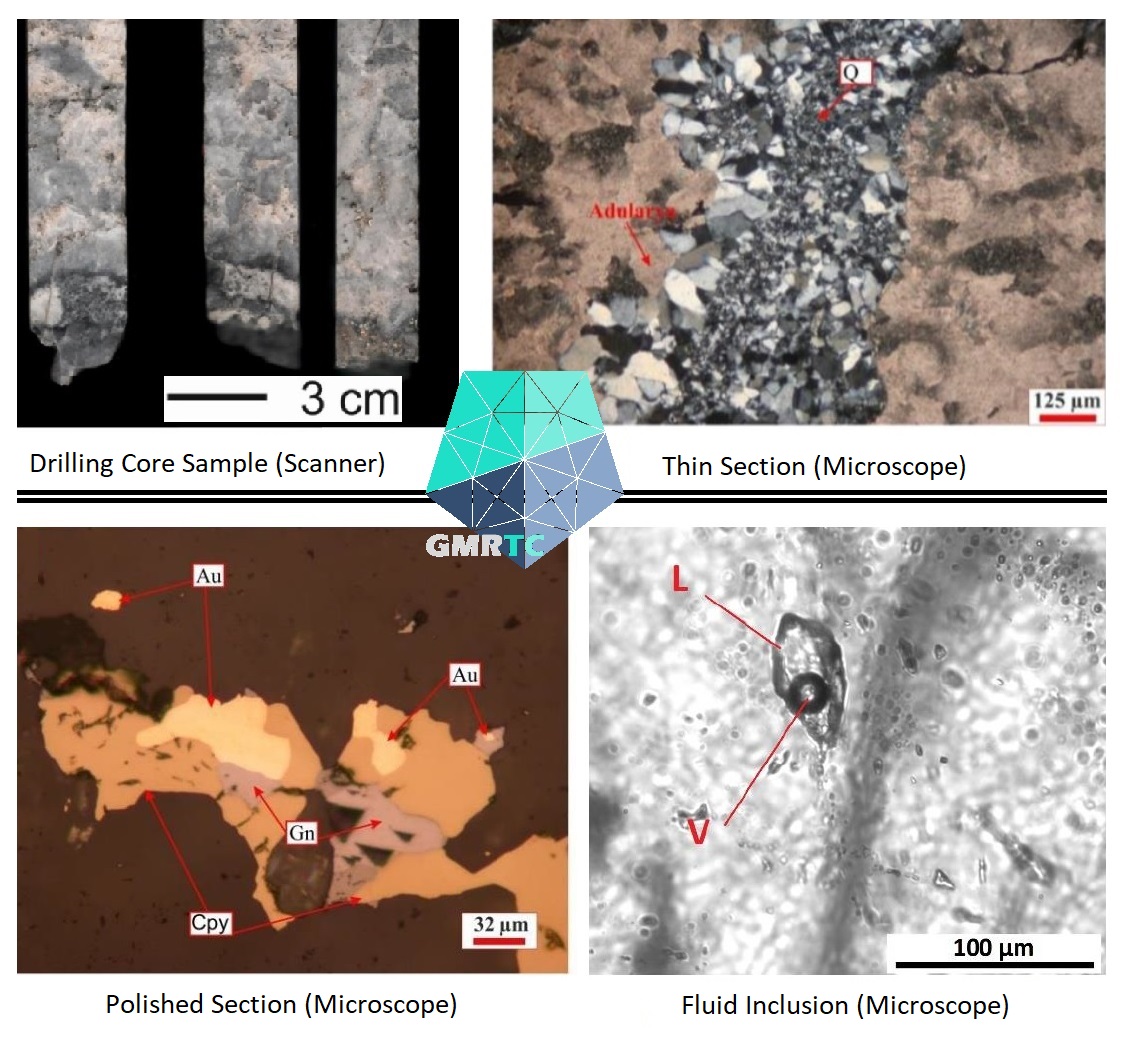
If possible, it would be beneficial to select high-grade samples from the ore body and host rocks and send them to the laboratory for polished and thin sections to be made in appropriate places. As your sample analysis results increase, the ore microscopy samples you choose will give you clearer information about the basis of mineralization and the origin of mineralization.
With a successful process, preparing fluid inclusion and stable isotope samples, as well as increasing results about the ore rock, can shed light on your ideas for the surroundings of your field on a regional scale.
Don’t forget to include quality assurance and quality control (QA/QC) samples in your sampling. Taking detailed photographs of your sample intervals, even valuable lithologies, will be beneficial for both your colleagues and your presentations, as well as your field knowledge.
You can go back to the beginning to question the above steps before the next line sampling, maybe something will change and this will be beneficial. After examining all these steps, we realized that we could sample representatively of a certain mass with line sampling. In addition, it can be said that with line sampling we distinguished the barren phases from the valuable phases and did not “miss” the ore body. Even if the value is at the anomaly level, you may have identified potential lithology that may have value along the line. In geology, sampling such as line, face and trench sampling are better methods than obtaining reliable data from drill cores. It should be preferred whenever possible at every stage of the mineral exploration process. Do not have high hopes or disappointments with rock chip samplings without developing the right process and studying the field properly. Because the grade / quality ratio of a mineral that can be seen with the naked eye in a specially selected hand sample will already be high compared to that mass. What should not be forgotten is, what size of mass the sample in question represents.
Subjects discussed in this article may overlap with your mineral exploration, modeling, mining operation and business development issues and may provide solutions for those. However, remember that various factors specific to your business may bring about different challenges. Therefore, seek support from expert consultants to evaluate all data together in order to convert potential into profit most efficiently.
Should you have any questions regarding the articles or consulting services, please don’t hesitate to get in touch with us.

GMRTC Mineral Exploration & Modeling & Operation Consultancy
Istanbul - Izmir - TÜRKİYE
SITE MAP
CONTACT US
Before quoting or copying from our site, you can contact info@gmrtc.com
All elements (texts, comments, videos, images) on the GMRTC website (www.gmrtc.com) are the property of GMRTC unless otherwise stated, and are published to provide insights to interested investors, professionals, and students. Any detail that may arise during your process will affect the subject matter you are interested in on this website; therefore, GMRTC (www.gmrtc.com) is not liable for any damages incurred. It is recommended that you consult experts with all your data before making any decisions based on the information provided.

